This is the the 13th blog post in the series about Azure Arc enabled Data Services.
The initial post can be found at Azure Arc enabled Data Services, part 1 – Intro and the whole collection can be found at Azure Arc enabled Data Services.
This post is dedicated to the basic monitoring with 2 tools that are provided right out of the box – Grafana & Kibana.
Kibana has been pretty much the log analytics tool standard for a pair of years,
while Grafana has been growing like crazy in adoption and should be considered as a default choice for a visitation tool.
I could go with an explanation of what both of these tools do, and which connections and plugins they have, but this is not the focus of this post and I suggest you discover it for yourself, if needed.
I have already pre-installed 2 instances of Azure SQL Managed Instances – one as a single instance (sql20) and other(s) with Availability Group (salha).
If you want to achieve the same result, please follow the steps indicated in the following blog posts – Azure Arc enabled Data Services, part 9 – Basic of the SQL Managed Instance & Azure Arc enabled Data Services, part 11 – SQL Managed Instance Availability Group for the single instance and Availability Groups respectively.
The access URLs for both Kibana and Grafana can be found in the end section of each of the SQL Managed Instance configurations, which can be obtained with the help of azdata arc sql mi show command:
azdata arc sql mi show -n sql20
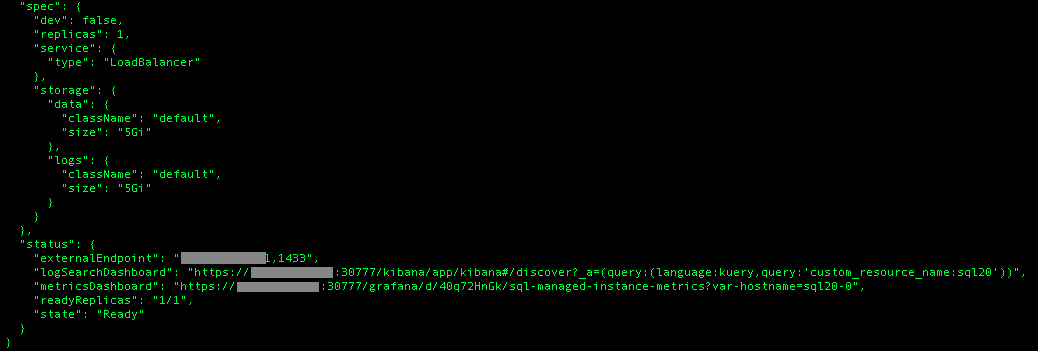
It is easy to decode the configuration, that contains the direct URL to the monitoring asset:
logSearchDashboard – corresponds to the Kibana
metricsDashboard – corresponds to the Grafana
Grafana
Let’s start with Grafana, the tool that allows to monitor visually a number of assets, including the Kubernetes, its underlying infrastructure and of course SQL Managed Instance and PostgreSQL.
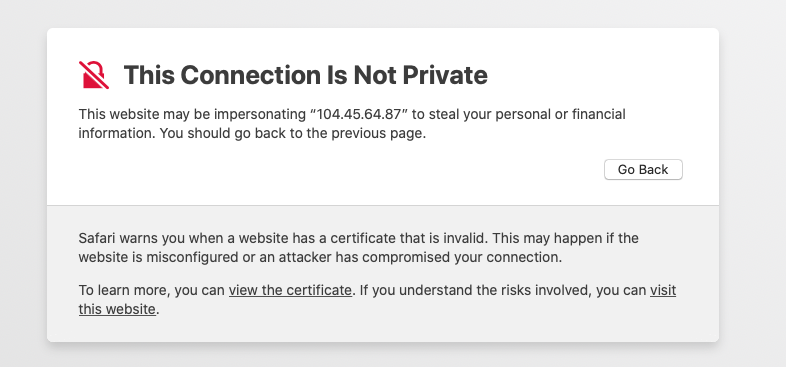 Right after opening the corresponding URL, I have been faced with the warning the certificate used for the access is not to be trusted and that I need to confirm my intentions, as you can see on the message on the left side of this text. Pushing forward and accepting the responsibility (while being sure that this is the IP we want to connect to) and after putting the Data Controller administrator credentials that we have used for its deployment, I was presented with the following view containing diverse metrics and visualisations:

Transactions, Batch Requests per Second, Wait Statistics (wow!), Memory Broker Clerks, Wait Tasks Counts, Buffer Cache Memory & Memory Manager are just some of the preconfigured visualisations available right out of the box.
Not on the image but scrolling below you will find the important metrics for the Availability Groups, such as Transaction Delay, Recovery Queue, Log Apply Pending Queue, Redone Bytes/sec, Log Bytes Received/sec, Bytes Sent to Transport/sec and others.
This is a fully configured dashboard that will allow you to monitor your SQL Managed Instance right out of the box, without any intervention.
Besides being able to observe the results, you can zoom in & out, select period of the observation, intervals and refresh frequency like usually in Grafana.
You can set up the additional data sources, configure alerting and so much further.
 In the top left corner, you can choose the exact SQL Managed Instance you want to see metrics on, with naturally Availability Groups with 3 instances will be presented as 3 separate instances, as one would expect. As your deployment will grow, so will the number of listed instances and at some certain point it will become obvious that the right choice of the names will help sorting and thus the selection of the right instance, because it will become scarily easy to make a decision based on the wrong data.
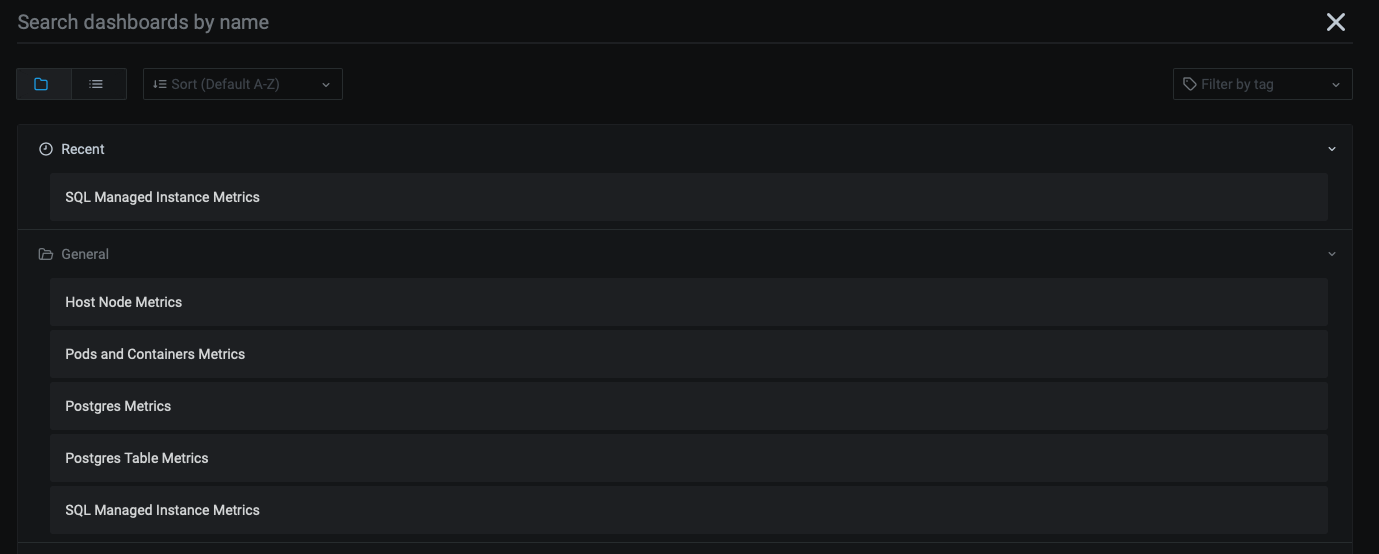
As already mentioned, SQL Managed Instance is not the only dashboard available out of the box – you have Pod & Container Metrics which allows you to observe the default and your own deployed pods & containers plus the Host Node Metrics which will allow you to observe and monitor the underlying nodes.
Pod & Container Metrics
As you can see on the image below, you can see and observe the behaviour and the impact of each of the individual pods and containers, without having to do anything to make it available.

Host Node Metrics
The same wondrous possibility is shown for the Host Node metrics, with information on the CPU, Memory, Kernel, Disk Space, Disk IOPS for the essential mounts between others are there ready for your consumption and analysis:

Custom Dashboard
Do not feel like you are finished with those metrics and feel free to create the combination of your own. I hope that eventually people will start sharing (maybe even on Github) allowing the whole community to grow.
More Stuff
I just want to reforce that you can do all the habitual Grafana stuff, like creating new users, configuration, alerting, exploring, etc – this is a complete Grafana as we know it.
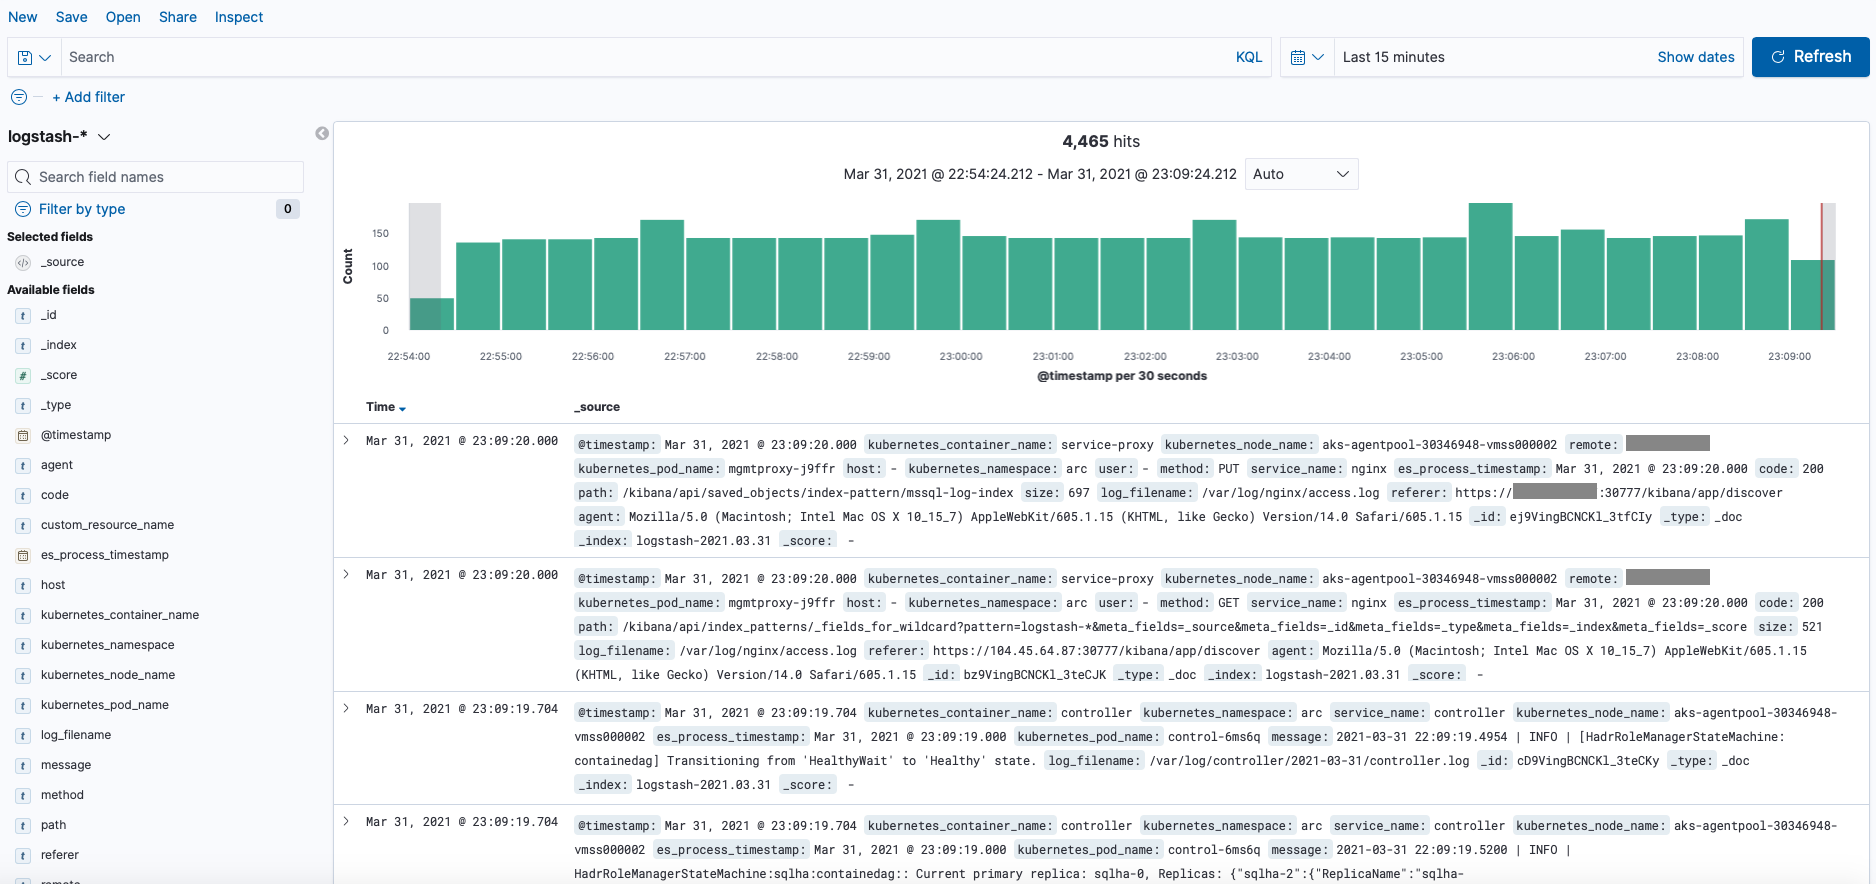
Kibana
After accessing Kibana HTTPS URL and being presented login screen as shown below
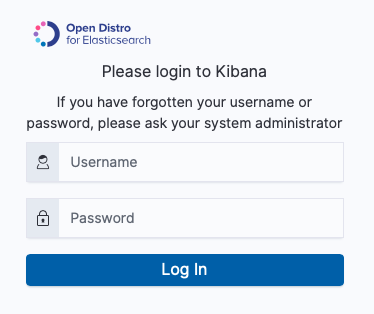
you need to input once again by default your Data Controller deployment credentials in order to log into it.
From there go and explore the logs either with the help of KQL (Kibana Query Language, do not mix it with the Microsoft’s KQL) or by setting the parameter that you need.
For example, below I have added a search for the “failover” term:
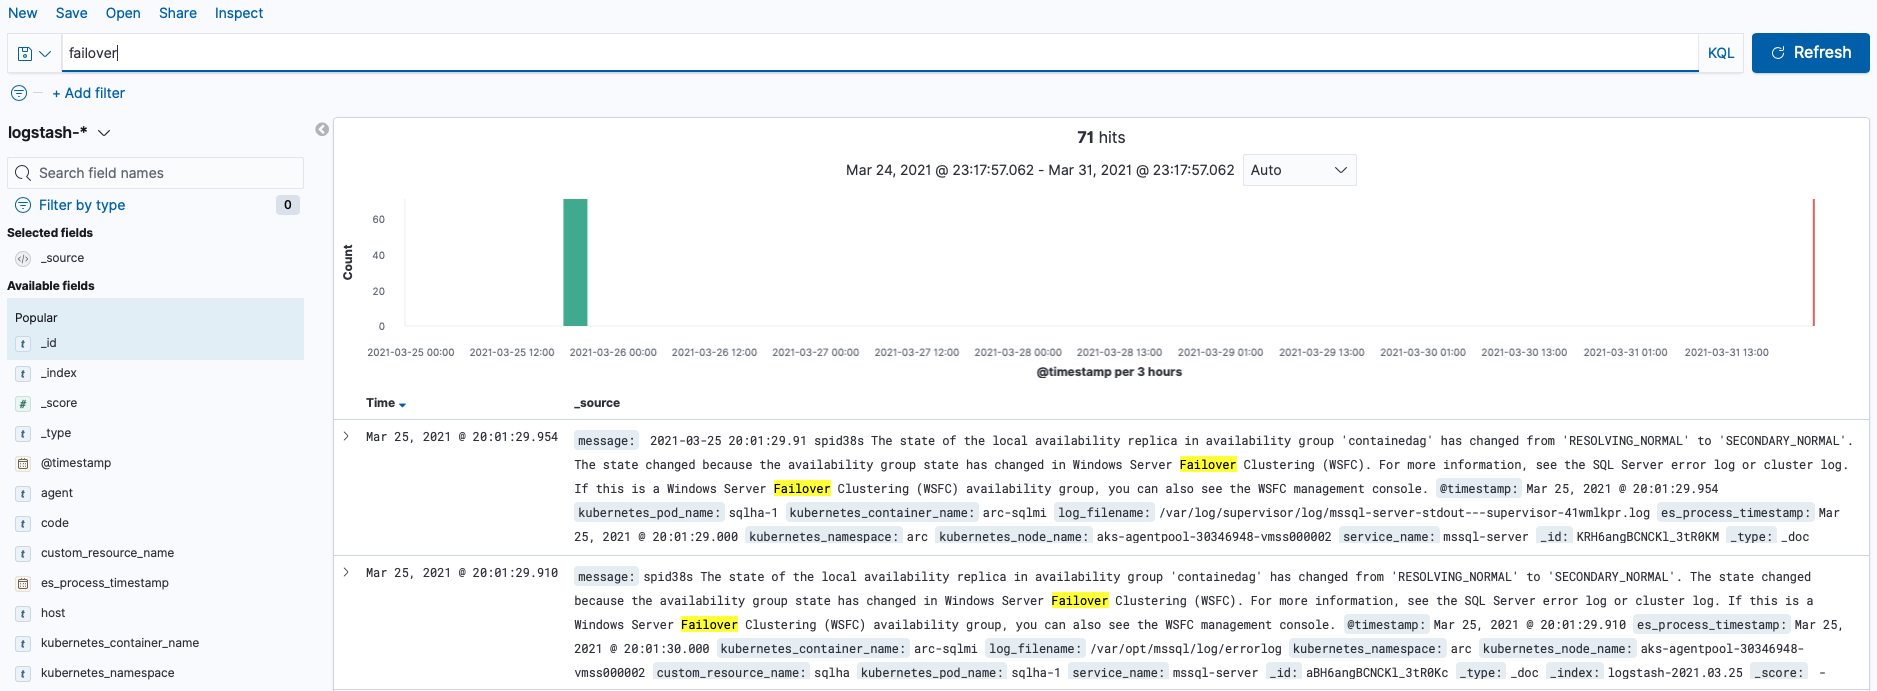
If you do not posses the skills to explore the basics, then you definitely should invest into it right away. It looks like Kibana is the weapon of choice for the event analysis and one might day it can become a basic requirement for any operational job.
Final Thoughts
Yes, indeed – these are largely the same metrics and visualisations that are available since Big Data Clusters, but given that the most people have probably never tried it out (and that there were no mentions of this feature for SQL Server 2019 in this blog previously), I want to make sure that the readers of my blog are aware how awesome those features are.
I love the possibility of concentrating just on the work instead of munching and preparing for days the stuff that is needed. Great vision on making them available.
to be continued
I just want to say thank you for this serie about Azure Arc enabled Dataservices. It really helps me a lot to better understand and build my own environment (on my local microk8s cluster). Your articles are really better than all other documents (including official MSFT) on that subject.