This is the the 8th blog post in the series about Azure Arc enabled Data Services.
The initial post can be found at Azure Arc for Data Services, part 1 – Intro and the whole collection can be found at Azure Arc enabled Data Services.
In this blog post we shall focus on the Indirectly Connected Mode to Azure – meaning that you will take yourself on the task of reporting to Azure on the consumption and the metrics & logs of the deployed and used Data Services.
If you have chosen the Indirectly Connected, there must be a good reason for it, because you are choosing a path that will require more work and eventually more responsibility for the bottom line. I imagine that a lot of mechanisms that on the Azure side for billing will have to be adjusted for the realities of failing jobs, because as you know “the perfect plan is the one that does not exist”.
Remember that the direct mode will take care of the reporting and through the mechanisms explained in Azure Arc for Data Services, part 5 – Service Principals for the Direct Mode, you might be dealing with all those details on your own.
It can be that your clusters can not be exposed to the internet through the security requirements or through the network settings that can’t & won’t be changed, or there are some regulatory limitations – whatever that is, it is your decision.
Requirements
We need to make sure that the Azure Provider is registered within our our Azure Subscription and for that purpose we need to execute the Azure CLI command (note that the type of the Microsoft.AzureArcData is changed with the previously used one Microsoft.AzureData):
az provider show -n Microsoft.AzureArcData -o table

In my case I already have the provider registered, but in the case you still need to do that, please execute the following statement, bearing in mind that it might take a couple of minutes to finish:
az provider register -n Microsoft.AzureArcData --wait
I am consciously skipping here the part of the login (AZ LOGIN), since in order to obtain the list of the providers within your subscription, you will need to log into your tenant and select your subscription.
Service Principals
Before proceeding to the extraction and upload topics, we need to make sure that we have the necessary Service Principals and Permissions as described in Azure Arc for Data Services, part 5 – Service Principals. We shall be needing the following 3 informations:
– The Secret: the secret for the application registration we created
– Client ID: our enterprise application id
– Directory: our Azure Active Directory tenant id
Additionally we shall need to set up the SPN_AUTHORITY url, which right now should simply be login.microsoftonline.com, unless you are using some different portal (thinking about governmental clouds):
export SPN_AUTHORITY='https://login.microsoftonline.com' export SPN_CLIENT_ID='' export SPN_CLIENT_SECRET=' ' export SPN_TENANT_ID=' '
If you won’t set those variables, you will be forced by the CLI commands to input the information and of course this would destroy all the fun of automating this task.
So after setting the Client Id, Client Secret and AAD Tenant Id we are ready to go with the information upload, but first of all we need to extract it!
There are 3 types of data that can be uploaded to Azure with one being definitely required (usage data) and 2 being free to my understanding (logs and metrics), but that most probably you will want to upload, unless you are forwarding them somewhere else or doing all of the analysis right away.
There are 2 operations as a matter of a fact for each of those data types:
1. Export – the act of extracting the information out of the respective repository and storing it somewhere locally
2. Upload – the act of uploading the exported information into Azure Portal.
Now, let’s take a look into the Usage Data and as a matter of a fact, the whole operation is pretty much the same invocation of the AZDATA ARC DC EXPORT command and with variation of the –type (-t) parameter, specifying either usage, logs or metrics.
PRO TIP: have a SQL Managed Instance and/or PostreSQL Hyperscale instance created previously, as otherwise I have seen some weirdness in the extraction data behaviour.
Usage Data
Let’s start with the export of the Azure Arc enabled Data Services usage data into the usage.json file in our arclogs folder:
Note: Apparently the usage can be extracted only after 24 hours of Data Controller installation and during the preview there is no cost associated with it. Once in the production, it is expected that the uploads with the usage extraction to take place on the daily basis.
The resulting file will contain the usage information on the SQL Managed Instance and the PostgreSQL.
In more details, the usage file will have the format of joined JSON
– “exportType”: usage
– “dataController”: JSON information of the Data Controller configuration
– “dataTimestamp”: timestamp of the information extraction
– “instances”: list of the SQL MI and/or PostgreSQL Hyperscale instances with their configurations and endpoints
– “data”: the usage collected for the respective instances
– “deletedInstances”: the instances that were removed since the last extraction
The extraction of the usage is pretty straight forward, as we indicate the export type and the path for the usage information destination:
azdata arc dc export -t usage -p arclogs/usage.json
![]()
![]()
When you first create a new Data Controller with the indirect connection, there will be no data right away, but soon enough it will come. :)
As mentioned before, there is no payment associated with this preview technology right now, and so we can still play and experiment with it.
The most relevant content of the “data” section is presented below with 2 subsections – usages & signature both containing encrypted information to my understanding:
cat arclogs/usage.json

It is always good to know how your sensitive data is about to travel and to be stored. This does not remove the necessity of you taking care of the data on the server where you export the data, so be sure to delete or encrypt it when archiving (much better option).
Metrics Data
The metrics file will contain the combination of the configuration of the Data Controller (AZDATA ARC DC CONFIG SHOW), the configuration information about the created & deleted resources (SQL MI or PostgreSQL), timestamps, and the metrics data itself, all combined in a single JSON document.
It has the following sections right now:
– “exportType”: metrics (makes sense, isnt it?)
– “dataController”: JSON information of the Data Controller configuration
– “dataTimestamp”: timestamp of the information extraction
– “instances”: list of the SQL MI and/or PostgreSQL Hyperscale instances with their configurations and endpoints
– “data”: the metrics collected for the respective instances
– “deletedInstances”: the instances that were removed since the last extraction
Lets run the command, storing the metrics in the arclogs folder:
azdata arc dc export -t metrics-p arclogs/metrics.json
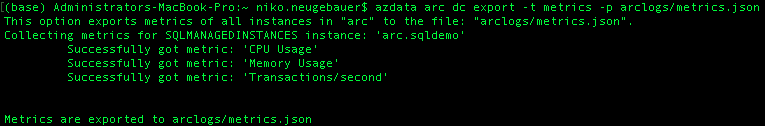
There is infinite few sense of showing you the details of the “data controller” section, since you can simply run the AZDATA ARC DC CONFIG SHOW command to obtain it, the same applies to the respective SQL MI & PostgreSQL instances, especially since in these series they were not officially yet created. :)
To see what is inside in the “data” section, here is an image of an older (a couple of months ago) extraction of the usage of one of the test instances:
cat arclogs/metrics.json
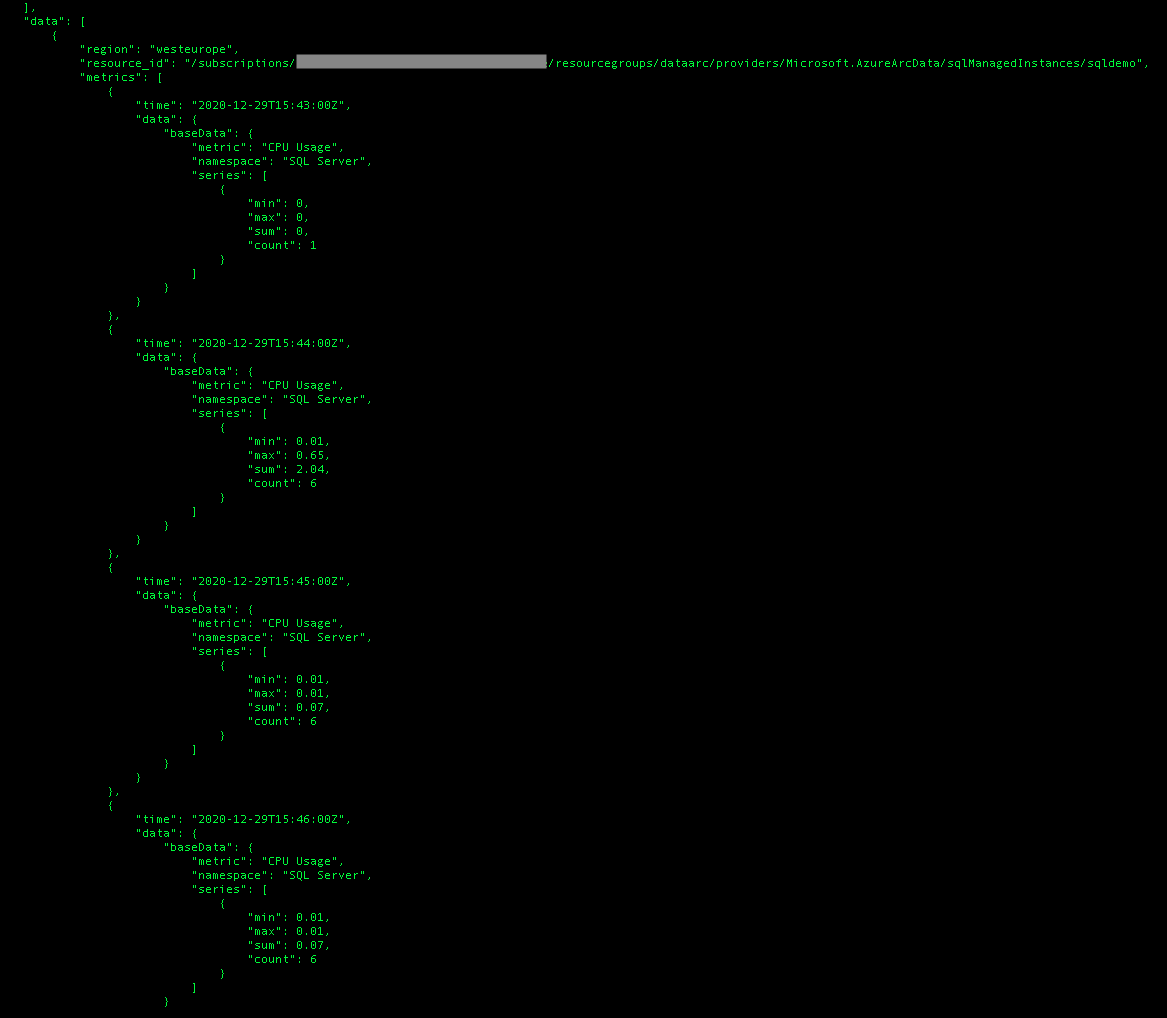
Seems to be very much self-explaining, with the minimum, maximum, count and average values, where my expectation the count should be representing the number of data points used in the subset data extraction.
Logs Data
Logs extraction is the process which typically takes more time as compared to the previous 2 operations. This takes place because the process extracts not just a couple of minutes, but the whole last 14 days of data, and if you have a lot of logs to analyse, your export might take some time.
As the previous extraction and because it uses the same api, the logs is using the same basic architecture, but with a little “flip”
– “exportType”: logs
– “dataController”: JSON information of the Data Controller configuration
– “dataTimestamp”: timestamp of the information extraction
– “instances”: list of the SQL MI and/or PostgreSQL Hyperscale instances with their configurations and endpoints
– “data”: instead of storing the logs directly in the file, we shall have a pointer to the list of logs file generated for the purpose and on the daily basis, having the pattern name of the extracted original file plus the numeric postfix “-n” where the n represents the numbers the number of the file starting from zero (0)
– “deletedInstances”: the instances that were removed since the last extraction
Let’s invoke the log extraction procedure with the help of AZDATA ARC DC EXPORT command
azdata arc dc export -t logs -p arclogs/logs.json
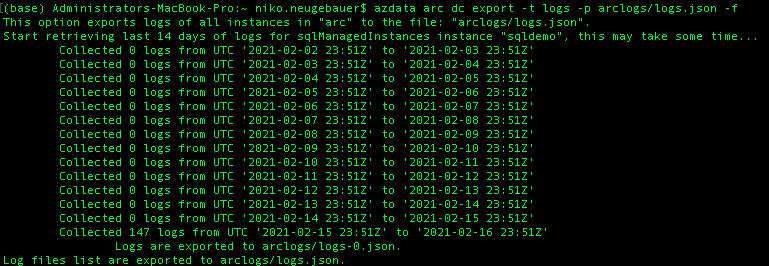
Success, now let’s open the logs.json file to find out that in order to see the actual logs, we need to open logs-0.json
cat arclogs/logs.json
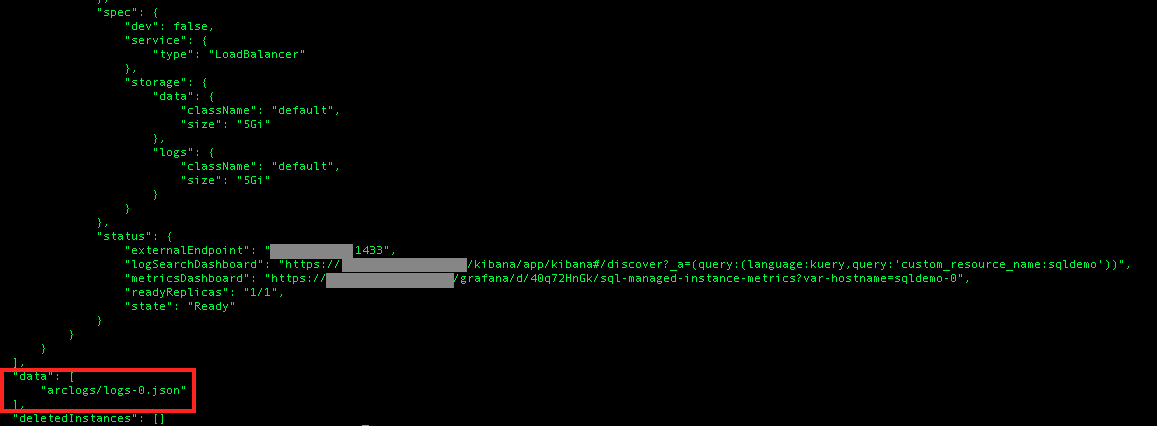
The logs-0.json as a matter of a fact is a file that will give us very few insights, since I expect it to be encrypted and probably compressed, but it will perfectly serve Log Analytics on Azure.
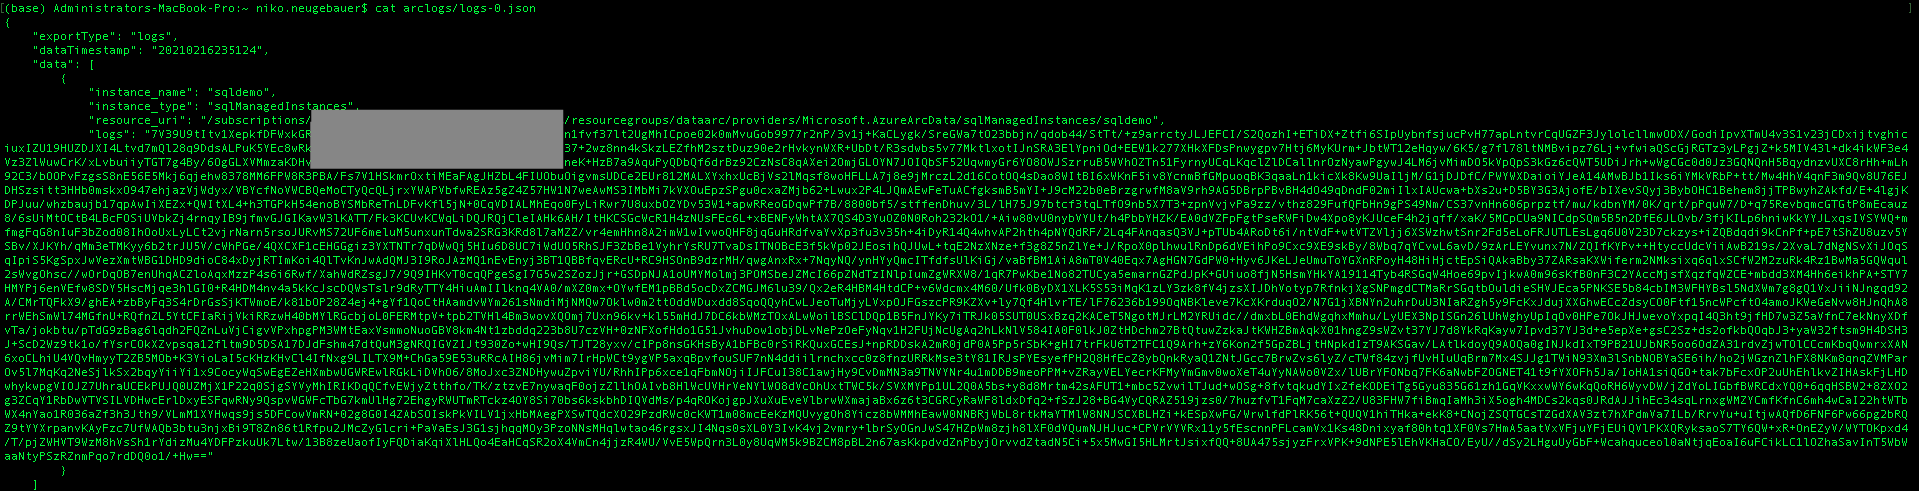
cat arclogs/logs-0.json
Uploading Extracted Data to Azure
Uploading data in a single command is easy
The Frequency aka the 30 minutes rule
The 30 minutes rule seems to be pretty easy – if you are uploading metrics that are older than 30 minutes, it will be ignored, so the good recommendation is to automate the process on some lower frequency, let’s say every 25 minutes.
For the usage data, the recommended frequency is apparently to be a daily process, but I will want to see how it changes by the RTM time.
The command to execute the upload is the AZDATA ARC DC UPLOAD and we do not need to specify the type, just the file itself and as we have seen, the file itself has the same format with small differences based on the type of the file, which is defined in the very first section within the file.
Here are the practical example of uploading extracted logs:
azdata arc dc upload -p arclogs/logs.json
![]()
and here is an example for the metrics
azdata arc dc upload -p arclogs/metrics.json

Notice that when automating, I suggest that every single extraction should be stored in a separate file, which should be encrypted & archived for a significant period of time. You know, just in case … ;)
to be continued with Azure Arc enabled Data Services, part 9 – Basic of the SQL Managed Instance