This is the the 6th blog post in the series about Azure Arc enabled Data Services.
The initial post can be found at Azure Arc for Data Services, part 1 – Intro and the whole collection can be found at Azure Arc enabled Data Services.
After thinking it through and re-reading the installation of the Data Controller that I did in the blogposts Azure Arc for Data Services, part 3 – Configuring on a plain vanila Kubernetes and Azure Arc for Data Services, part 4 – Configuring on a AKS, I had the feeling the there is a need for a little expansion and this blog post is to show you how you can check on the Data Controller and answer some of the questions.
Inside the Data Controller
As already mentioned previously, a freshly deployed Data Controller, without any services at all looks something like this (using get all command of the kubectl):
kubectl get all -n arc
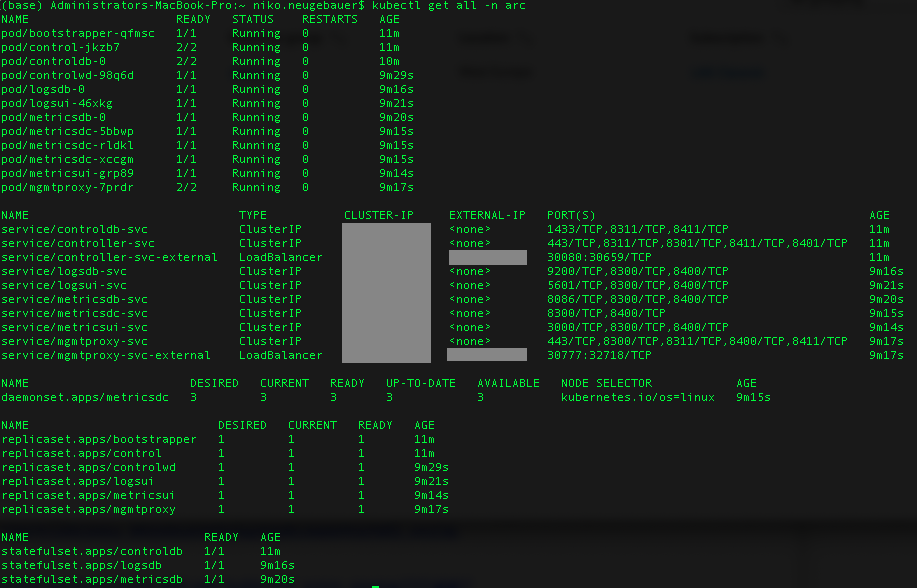
Precisely like the “little brother” Big Data Clusters, our control node :) has 12 pods, but then different 6 Replica Sets and 3 Stateful Sets with whole lotta services (10 to be precise).
Pods
Let’s go through all the pods individually and see what is inside of them. For this purpose and with the help of JSONPath we shall be extracting the lists of the configured containers, specifying the name of the pod in each invocation (kubectl get pods [pod_name] -o jsonpath='{.spec.containers[*].name}’ -n arc ).
The example of the command below will list the containers for the controldb-0 pod:
kubectl get pods controldb-0 -o jsonpath='{.spec.containers[*].name}' -n arc
This gives us the following internal structure (which can naturally change in any moment, since we are in the preview):
- bootstrapper-[random] has just one container that is called bootstrapper(base), which to my understanding is a bootstrapper part of the DC. It is the very first pod that gets installed.
- control-jkzb7-[random] has 2 containers – fluentbit and controller(base) (forwarder and controller itself)
- controldb-0 has 2 containers – fluentbit and mssql-server(base) (forwarder and my favourite database engine – SQL Server on Linux)
- controlwd-[random] has 1 container – controlwatchdog(base)This must be the controller node kind of a heartbeat overseer.
- logsdb-0 has 1 container – elasticsearch(base)This is our Kibana source, the Elastic Search
- logsui-[random] has 1 container – kibana(base)This is our Kibana Web Interface, based on the logsdb-0 container elasticsearch(base)
- metricsdb-0 has 1 container – influxdb(base)This is our Grafana Database – InfluxDB
- metricsdc-[random] has 1 container – telegraf(base)This is our open source agent, helping to collect server metrics, this is an alternative for the collectD This container is definitely working together with the influxdb(base) container in the metricsdb-0 pod. Note that there are 3 such pods and containers in total.
- metricsui-[random] has 1 container – grafana(base)This container will provide the web interface for the Grafana, allowing an easy way to consume and visualize the collected system & deployed services performance metrics
- mgmtproxy-[random] has 2 containers – fluentbit(base) and service-proxy. The management service proxy serves for the communication and services management.
Even though it looks like an extremely complex structure, overall we have the following key elements in the architecture:
– Bootstrapper (core)
– Controller
– Kibana (logs)
– Grafana (metrics)
with the rest being supportive elements.
Persistent Volume & Persistent Volume Claims
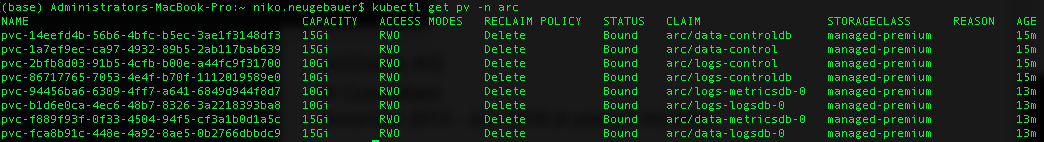
Listing the elements that were installed by default, we are able to list the Persistent Volume & Persistent Volume Claims as indicated below:
kubectl get pv -n arc
kubectl get pvc -n arc
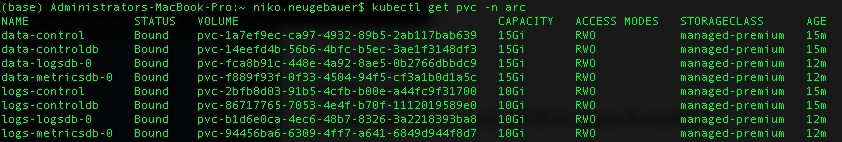
It is an easy calculation to do that right away we just gave 100 GB to the controller (10GB x 4 + 15GB x 4), with data consuming 15 GB by default and logs left with 10GB a piece. The real consumers are ControlDB with SQL Server, Grafana & Kibana with their respective infrastructure and the controller itself.
Replica Sets
Replica Sets serve to define the number of the pods that are running at any given time. It is used for the purpose of High Availability.
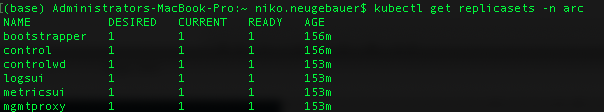
You can see that as a matter of a fact, we have 6 of them, corresponding much to the pods we have seen above in the section on the containers & pods – 2 UI pods for Kibana and Grafana, the bootstrapper, management proxy and controlld with its watchdog.
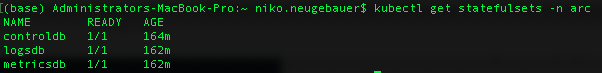
Stateful Sets
The stateful sets here are only for the controller itself, Kibana and Grafana:
Services
The abstraction and policies for accessing Kubernetes pods are called services and in the Data Controller of the Azure Arc enabled Data Services, they are well defined entry and mapping points between diverse IPs and Ports, as you can see on the picture below:
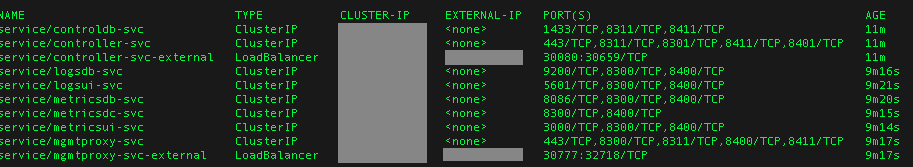
You will find every relevant pod defined with its own unique function, such as Load Balancer or Cluster IP.
Endpoints
To list the relevant endpoints for connection, consumption of logs and metrics and the management, you need to know connection endpoints and for this purpose AZDATA contains the following command:
azdata arc dc endpoint list
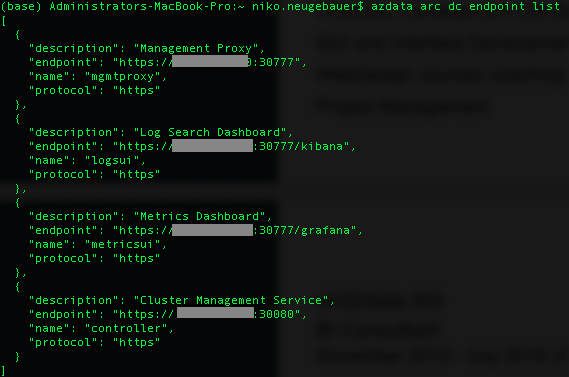 These endpoints correspond to 4 major services that are available right out-of-the box:
– Management Proxy (management API, mgmtproxy pod)
– Log Search Dashboard (Kibana, logsui pod)
– Metrics Dashboard (Grafana, metricsui pod)
– Cluster Management Service (This is how we manage our cluster, controller pod)
The most wonderful thing about this services and respective URLs is that you can right away log into 3 of them (with your endpoint URL) and start using and exploring them. We shall look in detail at Kibana and Grafana, once we install and use the Data Services with SQL Managed Instance and PostgreSQL Hyperscale, but maybe I will dedicate one of the next blog posts towards the exploration of the basics…
Using the endpoint for the Cluster Management Service we can start seeing and managing some of the things in Azure Data Studio.
Data Controller Cluster Management in Azure Data Studio
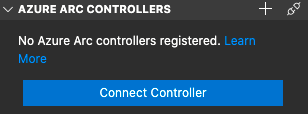 After installing and enabling the extension for the Azure Arc Controller in Azure Data Studio, as required and mentioned in Azure Arc for Data Services, part 2 – Requirements and Tools, you should be able to see the same image I am presenting on the left side of this text. The possibility to connect to the Data Controller is quite limited in the moment, and we are able to connect to just 1 at the time, and without a chance of saving the connection for late usage.
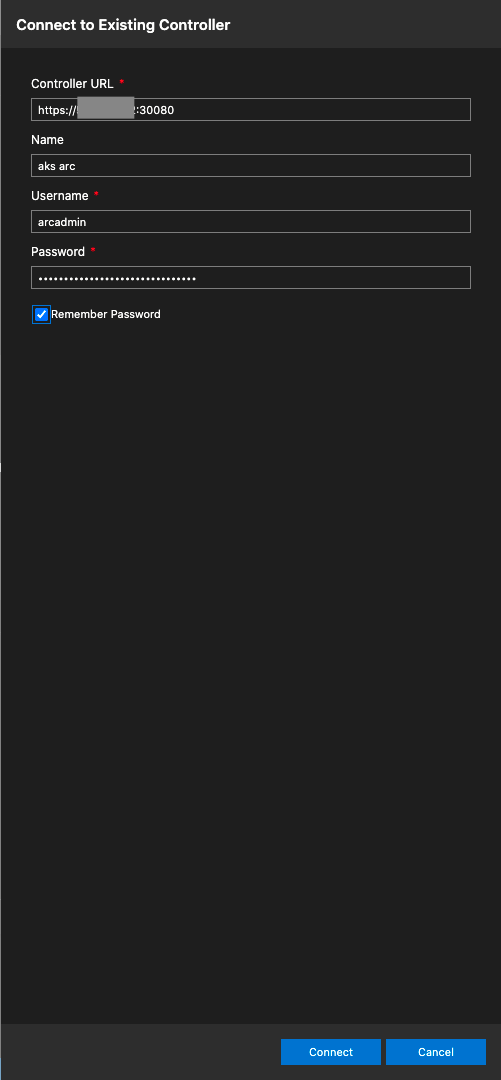 Once you click on the CONNECT button you will be presented with a screen where you specify the connection endpoint, connector name, username and password for connection to the Data Controller of your Azure Arc enabled Data Services.
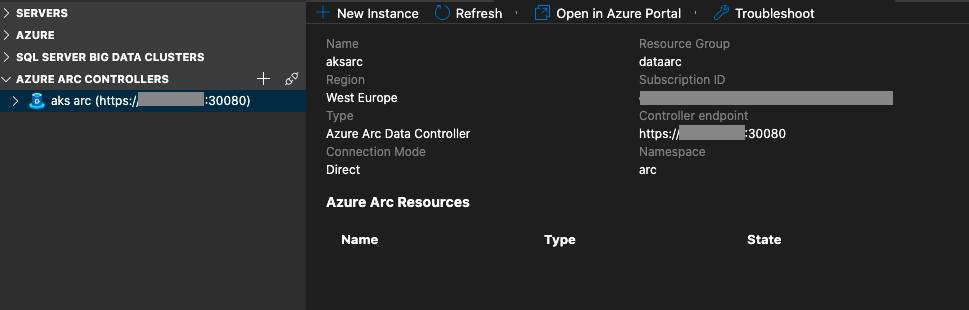 After a successful connection you will provided with a possibility of an overview of the connected Data Controller, plus the management capabilities of further deployments of the associated data services (which are currently just 2 – SQL Managed Instance and PostgreSQL Hyperscale).
Managing Azure Arc Data Controller
There are a couple of management commands for the Data Controller that are already available inside the AZDATA library (azdata arc dc …):
– Create a Data Controller
– Delete a Data Controller
– Debug – you can either export the logs for the troubleshooting or even trigger memory dumps for Microsoft or Kubernetes provider teams analysis
– Endpoint – just list them currently here, but you should be able to alter them in the configuration section
– Config – List the configuration, modify it, patch it, and initialise with a different profile.
– Export the metrics of the usage
– Upload the exported metrics to Azure for reporting the usage and logs
– Show the status of the controller
Let’s see a couple of the sample commands:
azdata arc dc status show
in which case any response besides ready means that the Data Controller is not ready for business and you are either deploying, deleting or having troubles.
![]()
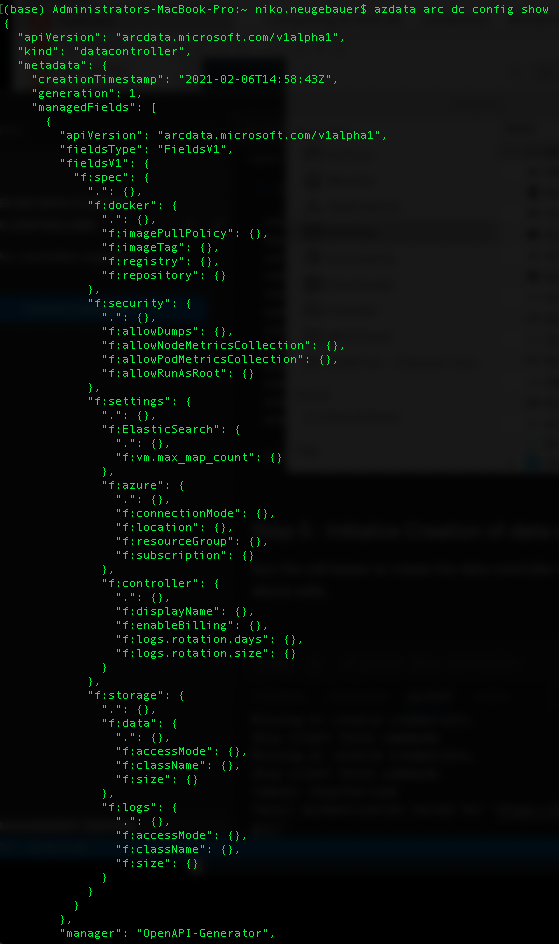
The following command will show the initial part of the Data Controller configuration, with which we shall deal in details some other time:
azdata arc dc config show
Deleting Data Controller
Once you need to delete your Data Controller, you might be needing currently to do not just 1 but a couple of operations and notice that you can not do that in Portal currently:
1. Delete the Data Controller with the help of the AZDATA ARC DC DELETE command
2. Make sure that all of the associated Data Services are deleted as well
3. Force the removal of the associated resource from Azure (I have been constantly seeing that the resource is not deleted for some reason)
4. Consider removing the namespace where you installed Data Controller, unless it contains some critical information that you expect to extract
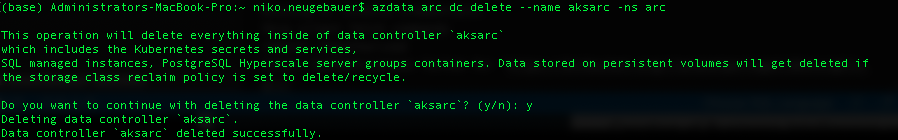
1. Let’s delete the Data Controller of our Azure Arc enabled Data Services:
azdata arc dc delete --name aksarc -ns arc
Note that it takes a couple of minutes to finalize this operation.
2. Let’s list the associated SQL Managed Instance and PostgreSQL Hyperscale services and delete them, if necessary
azdata arc sql mi list
azdata arc postgres server list

Nothing, that’s good!
3. Delete Azure Resources
az resource delete --name aksarc --resource-type Microsoft.AzureArcData/dataControllers --resource-group dataarc
![]()
4. Cleanup the Kubernetes Namespace where the DC was installed:
kubectl detele namespace arc
![]()
Voilá! :)
Multiple Data Controllers
Is it possible to install multiple Data Controllers on the same Kubernetes cluster ?
Yes, it is possible, and big service providers and/or datacenter providers might be considering how to take advantage and optimize their infrastructure with this steps.
The thing is that right now, you have to install them in the different namespaces, and for regular work with AZDATA, you will need to re-login with the help of azdata login command, while you should be using the following query to extract the name of the controller – ‘spec.settings.controller’:
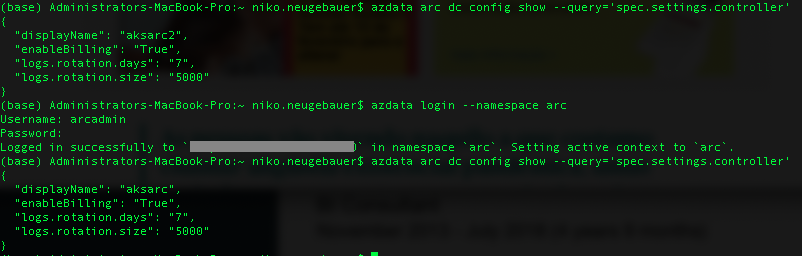
I do not like this functionality and I would absolutely love that in the future we would be able to do an authorisation just once, working with different Data Controllers without any constraint and forced switching. For using in a complex environment with multiple teams working with distinct and separated (sometimes legally required) customers.
The same thing goes for Azure Data Studio extension, which allows connection to just a single Data Controller at the same time, as mentioned previously.
to be continued with Azure Arc enabled Data Services, part 7 – Data Controller Custom Configuration