Continuation from the previous 100 parts, the whole series can be found at https://www.nikoport.com/columnstore/.
This blogpost will focus on warning you against considering just 1 aspect when analysing Columnstore Indexes performance, while coming back to the good old theme of the right data type selection. Comparing 1 aspect of the performance might not be the best choice, and basing your conclusions on the estimations might be a very wrong strategy.
A lot of times, in the field, I see people saying that because their Disk access is slow, the IO access numbers represent the paramount of their performance and that’s is why other performance aspects are off the table (:)), or at least for the initial analysis.
Let’s say I am running a couple of quite simple and basic queries against rather simple table (and let it be FactOnlineSales, to change the stuff a little bit – LOL) with just 2 million rows, that was taken from the free ContosoRetailDW sample Database from Microsoft:
SET STATISTICS IO, TIME ON

SELECT COUNT(*) as TotalRowCount
	FROM [dbo].[FactOnlineSales_SampleA];

SELECT COUNT(*) as TotalRowCount
	FROM [dbo].[FactOnlineSales_SampleB];
The execution time and the output of both of those tables are fine, as you can see below:
(1 row(s) affected)
Table 'FactOnlineSales_SampleA'. Scan count 1, logical reads 0, physical reads 0, read-ahead reads 0, lob logical reads 24, lob physical reads 0, lob read-ahead reads 0.
Table 'FactOnlineSales_SampleA'. Segment reads 4, segment skipped 0.

 SQL Server Execution Times:
   CPU time = 0 ms,  elapsed time = 0 ms.

(1 row(s) affected)
Table 'FactOnlineSales_SampleB'. Scan count 1, logical reads 0, physical reads 0, read-ahead reads 0, lob logical reads 24, lob physical reads 0, lob read-ahead reads 0.
Table 'FactOnlineSales_SampleB'. Segment reads 4, segment skipped 0.

 SQL Server Execution Times:
   CPU time = 0 ms,  elapsed time = 0 ms.
We have issued 24 logical lob reads and everything was fine, especially since the query processing time was about 0 ms. I imagine anyone reading this post and thinking “0 ? Zero ? Aka Nothing ?” Yeap, it is …
This would be a huge blog post talking about how something was so fast that it would show 0 ms for processing time on the table that hosts 2 million rows and I truly believe that Microsoft should start thinking enabling microseconds information when working with Columnstore Indexes.
Let’s just be happy at the moment and keep on firing our test queries :)
Now, let’s fire another set of queries against our test tables, still some basic ones – nothing extraordinare :)
(and notice, that this is a developer edition of SQL Server meaning that all enterprise features are totally enabled)
SET STATISTICS IO ON

SELECT SUM(TotalCost) as TotalCost
	FROM [dbo].[FactOnlineSales_SampleA]

SELECT SUM(TotalCost) as TotalCost
	FROM [dbo].[FactOnlineSales_SampleB]
The results are the very similar for the disk access, but they are not the same:
(1 row(s) affected)
Table 'FactOnlineSales_SampleA'. Scan count 1, logical reads 0, physical reads 0, read-ahead reads 0, lob logical reads 312, lob physical reads 0, lob read-ahead reads 0.
Table 'FactOnlineSales_SampleA'. Segment reads 4, segment skipped 0.

(1 row(s) affected)
Table 'FactOnlineSales_SampleB'. Scan count 1, logical reads 0, physical reads 0, read-ahead reads 0, lob logical reads 320, lob physical reads 0, lob read-ahead reads 0.
Table 'FactOnlineSales_SampleB'. Segment reads 4, segment skipped 0
We have 8 more lob logical reads with the SampleB table, which represents a very insignificant percentage when compared to the total number of the 320 lob logical reads – these are 0.5% to the total amount of disk access, but let us measure the speed as well:
SET STATISTICS TIME ON

SELECT SUM(TotalCost) as TotalCost
	FROM [dbo].[FactOnlineSales_SampleA]

SELECT SUM(TotalCost) as TotalCost
	FROM [dbo].[FactOnlineSales_SampleB]
My results are shown below:
 SQL Server Execution Times:
   CPU time = 0 ms,  elapsed time = 4 ms.

 SQL Server Execution Times:
   CPU time = 63 ms,  elapsed time = 58 ms.
This might be some of the favourite WTF moments for someone who is new to the Columnstore Indexes, How on earth with the very same data and the very same optimisations (no trace flags, and while being on the same machine) can we get response times that shall differ 12 times, while the IO differs just 0.5% ? We definitely need to include the actual execution plans of those queries to be able to arrive to any conclusion!
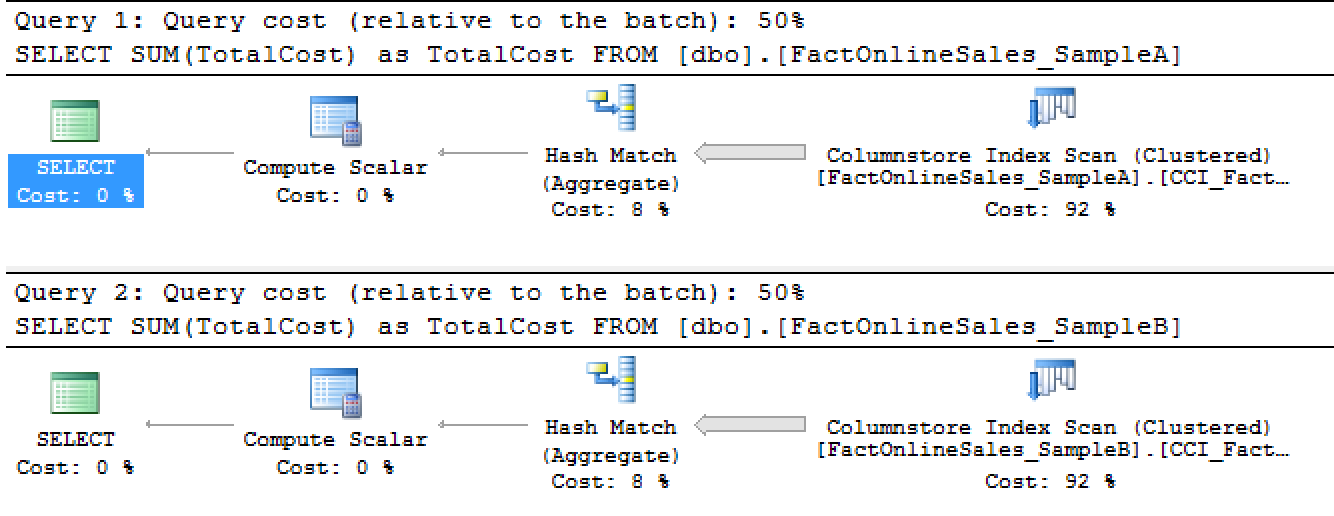
First of all, if you look at the estimated costs for the plans, then you shall see that they are equals, the SSMS (SQL Server Management Studio) shows us 50% split between them. Yes, there is a difference in how they look, “but SQL Server says they will be equal, and not 12 times different !” (© TM unknown)
Notice that for the Columnstore Indexes your estimated execution plan can be VERY different from actual one, especially in the terms of the real performance.
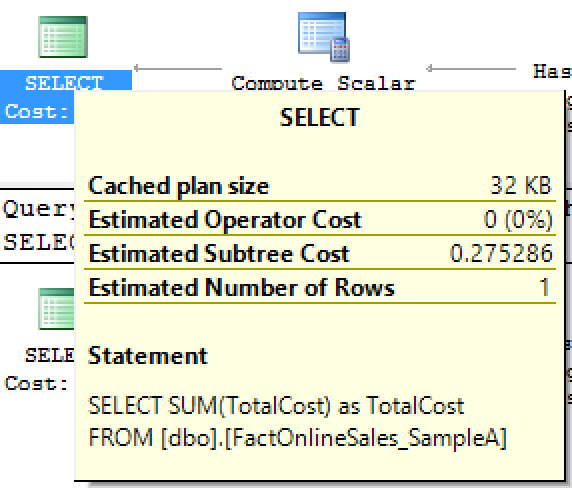 Even if we look at the estimated cost of the individual plan we see absolutely the same numbers – 0.275286 for both of the queries, making them look extremely similar or even the same!
This can’t be right ! Why the heck SQL Server is making them so different? Is this a bug?
No … This _ is _ Sparta! (otherwise known as a Predicate Pushdown)
The big fat arrow with the 2 million rows shows that the predicate pushdown worked on the first table while did not
worked at all on the second sample table (FactOnlineSales_SampleB).
Let’s take a look at the table definitions, there must be an explanation,
and here is the code that defines the first table:
CREATE TABLE [dbo].[FactOnlineSales_SampleA](
	[OnlineSalesKey] [int] NOT NULL,
	[DateKey] [datetime] NOT NULL,
	[StoreKey] [int] NOT NULL,
	[ProductKey] [int] NOT NULL,
	[PromotionKey] [int] NOT NULL,
	[CurrencyKey] [int] NOT NULL,
	[CustomerKey] [int] NOT NULL,
	[SalesOrderNumber] [nvarchar](20) NOT NULL,
	[SalesOrderLineNumber] [int] NULL,
	[SalesQuantity] [int] NOT NULL,
	[SalesAmount] [money] NOT NULL,
	[ReturnQuantity] [int] NOT NULL,
	[ReturnAmount] [money] NULL,
	[DiscountQuantity] [int] NULL,
	[DiscountAmount] [money] NULL,
	[TotalCost] [numeric](18, 3) NOT NULL,
	[UnitCost] [money] NULL,
	[UnitPrice] [money] NULL,
	[ETLLoadID] [int] NULL,
	[LoadDate] [datetime] NULL,
	[UpdateDate] [datetime] NULL
);
CREATE CLUSTERED COLUMNSTORE INDEX [CCI_FactOnlineSales_SampleA]
	ON [dbo].[FactOnlineSales_SampleA] WITH (DROP_EXISTING = OFF, COMPRESSION_DELAY = 0) ON [PRIMARY];
and here is the code for the second table:
CREATE TABLE [dbo].[FactOnlineSales_SampleB](
	[OnlineSalesKey] [int] NOT NULL,
	[DateKey] [datetime] NOT NULL,
	[StoreKey] [int] NOT NULL,
	[ProductKey] [int] NOT NULL,
	[PromotionKey] [int] NOT NULL,
	[CurrencyKey] [int] NOT NULL,
	[CustomerKey] [int] NOT NULL,
	[SalesOrderNumber] [nvarchar](20) NOT NULL,
	[SalesOrderLineNumber] [int] NULL,
	[SalesQuantity] [int] NOT NULL,
	[SalesAmount] [money] NOT NULL,
	[ReturnQuantity] [int] NOT NULL,
	[ReturnAmount] [money] NULL,
	[DiscountQuantity] [int] NULL,
	[DiscountAmount] [money] NULL,
	[TotalCost] [numeric](19, 3) NOT NULL,
	[UnitCost] [money] NULL,
	[UnitPrice] [money] NULL,
	[ETLLoadID] [int] NULL,
	[LoadDate] [datetime] NULL,
	[UpdateDate] [datetime] NULL,
);

CREATE CLUSTERED COLUMNSTORE INDEX [CCI_FactOnlineSales_SampleB]
	ON [dbo].[FactOnlineSales_SampleB] WITH (DROP_EXISTING = OFF, COMPRESSION_DELAY = 0) ON [PRIMARY]
Where is the difference?
It is to be found within our [TotalCost] column definition:
Table SampleA:
	[TotalCost] [numeric](18, 3) NOT NULL,
Table SampleB:
	[TotalCost] [numeric](19, 3) NOT NULL,
The real difference is just one number in the precision 18 vs 19, meaning that in the case of the table A, it will take 8 bytes for the data storage, while for the column B it will take 9 bytes, thus making it totally impossible for the aggregate predicate pushdown operations to be executed on the SampleB table.
Notice that the compression engine is very efficient and it will compress the data in the column with just 0.5% difference, which will make you believe something different (data distribution between the Row Groups, some pressures, bugs, whatever),
while the truth is rather simple.
Take a look at the actual execution plans, presented here below:
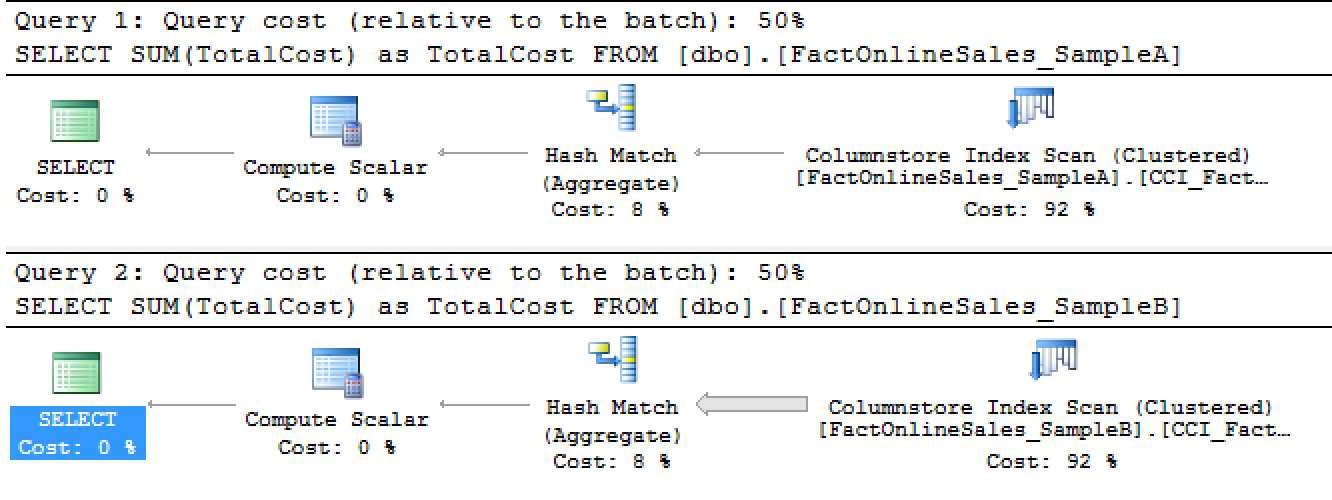
Even though they are estimated to cost the same (50% for each one) with the estimated cost of 0.275286 to be more precise in this sense.
To be more precise in the reality you will notice the Aggregate Predicate Pushdown taking place on the first query, while the second query is using the Storage Engine to read out all of the 2 million rows from the table and filter it in the Hash Match iterator.
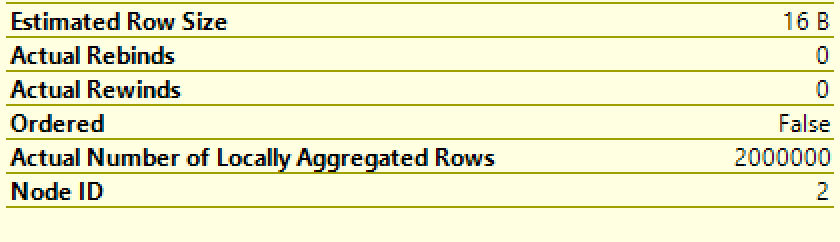 Actual Number of Locally Aggregated Rows is the one property on the Columnstore Index Scan iterator that will give you an insight on what happened within the Columnstore Index Scan, since the Aggregate Predicate Pushdown is not shown as a filter on the property. This is not the most fortunate solution as far as I am concerned, but since the 0 rows flowing out of the Columnstore Index Scan will serve as a good indication that Aggregate Predicate Pushdown took place, but if you want to be sure of all the details you will need to check the properties of the involved iterators.
Additionally, if you are like me, sometimes looking into the returned XML of the execution plans, you will instantly see the difference:
Table SampleA:Table SampleB:
It is all about the ActualLocallyAggregatedRows attribute which shows that the first query our 2 Million Rows being aggregated by the Storage Engine, while the 2nd query just throws the CPU power of the Batch Execution Mode against the data and crunches it – and notice that this is exactly what the Standard & lower SKU Editions shall do as well.
The lesson here for everyone is very simple, know your data types and when defining a table for BI, Reporting or Data Warehousing solutions, do not just write DECIMAL( 36, 12 ) just because you can or copied code from the internet.
Please, use your brain, knowledge and experience – smaller data types work MUCH faster and they are the first to get the advanced functions support. Do not rely on the storage engine that will compress your data incredibly well, because the very same Storage Engine might not be able to execute some of the most advanced functionalities because you simply made a wrong choice for the data type.
to be continued with Columnstore Indexes – part 102 (“CCI with Secondary Rowstore Indexes on SQL 2014”)
You are SUPERB !!!!!!