Continuation from the previous 46 parts, starting from https://www.nikoport.com/2013/07/05/clustered-columnstore-indexes-part-1-intro/
This post is a continuation from the the post 44, where I have listed different Extended Events.
In this post I will go into practical examples with detailed explanations on how to use those events.
Using ContosoRetailDW database as an example let us restore a copy of it and create a Columnstore Index on dbo.FactOnlineSales table that is using Segment Clustering on the OnlineSalesKey column:
USE [master]

alter database ContosoRetailDW
	set SINGLE_USER WITH ROLLBACK IMMEDIATE;

RESTORE DATABASE [ContosoRetailDW]
	FROM  DISK = N'C:\Install\ContosoRetailDW.bak' WITH  FILE = 1,
		MOVE N'ContosoRetailDW2.0' TO N'C:\Data\ContosoRetailDW.mdf',
		MOVE N'ContosoRetailDW2.0_log' TO N'C:\Data\ContosoRetailDW.ldf',
		NOUNLOAD,  STATS = 5;

alter database ContosoRetailDW
	set MULTI_USER;
GO
use ContosoRetailDW;

ALTER TABLE dbo.[FactOnlineSales] DROP CONSTRAINT [FK_FactOnlineSales_DimCurrency]
ALTER TABLE dbo.[FactOnlineSales] DROP CONSTRAINT [FK_FactOnlineSales_DimCustomer]
ALTER TABLE dbo.[FactOnlineSales] DROP CONSTRAINT [FK_FactOnlineSales_DimDate]
ALTER TABLE dbo.[FactOnlineSales] DROP CONSTRAINT [FK_FactOnlineSales_DimProduct]
ALTER TABLE dbo.[FactOnlineSales] DROP CONSTRAINT [FK_FactOnlineSales_DimPromotion]
ALTER TABLE dbo.[FactOnlineSales] DROP CONSTRAINT [FK_FactOnlineSales_DimStore]

ALTER TABLE dbo.[FactOnlineSales] DROP CONSTRAINT [PK_FactOnlineSales_SalesKey]

-- Create a traditional clustered index on FactOnlineSales that will be ordered by the OnlineSalesKey
create clustered index [PK_FactOnlineSales] on dbo.FactOnlineSales (OnlineSalesKey)
	with (DATA_COMPRESSION = PAGE);

-- Create a Columnstore with MAXDOP = 1, to get a perfect Segment Clustering
create clustered columnstore index [PK_FactOnlineSales] on dbo.FactOnlineSales
	with (DROP_EXISTING = ON, MAXDOP = 1);
Columnstore Building & Rebuilding
For building & rebuilding Columnstore Indexes, there are 5 distinct events that are extremely useful for troubleshooting your system –
clustered_columnstore_index_rebuild, column_store_index_build_low_memory, column_store_index_build_throttle, column_store_index_build_process_segment, column_store_code_coverage.
For my tests I use this single Extended Session Event which includes them all (Warning, some of the option require this event to be run only on the Test environment):
CREATE EVENT SESSION [clustered_columnstore_index] ON SERVER
ADD EVENT sqlserver.clustered_columnstore_index_rebuild(
    ACTION(sqlserver.database_id,sqlserver.query_hash,sqlserver.query_plan_hash,sqlserver.sql_text)),
ADD EVENT sqlserver.column_store_code_coverage(
    ACTION(sqlserver.database_id,sqlserver.query_hash,sqlserver.query_plan_hash,sqlserver.sql_text)),
ADD EVENT sqlserver.column_store_index_build_low_memory(
    ACTION(sqlserver.database_id,sqlserver.query_hash,sqlserver.query_plan_hash,sqlserver.sql_text)),
ADD EVENT sqlserver.column_store_index_build_process_segment(
    ACTION(sqlserver.database_id,sqlserver.query_hash,sqlserver.query_plan_hash,sqlserver.sql_text)),
ADD EVENT sqlserver.column_store_index_build_throttle(
    ACTION(sqlserver.database_id,sqlserver.query_hash,sqlserver.query_plan_hash,sqlserver.sql_text))
ADD TARGET package0.event_file(SET filename=N'C:\Temp\columnstore_index.xel')
WITH (EVENT_RETENTION_MODE=NO_EVENT_LOSS,MAX_DISPATCH_LATENCY=5 SECONDS)
GO
After starting the event, I simply fire away a re-creation process for the Columnstore Index:
create clustered columnstore index [PK_FactOnlineSales] on dbo.FactOnlineSales
	with (DROP_EXISTING = ON);
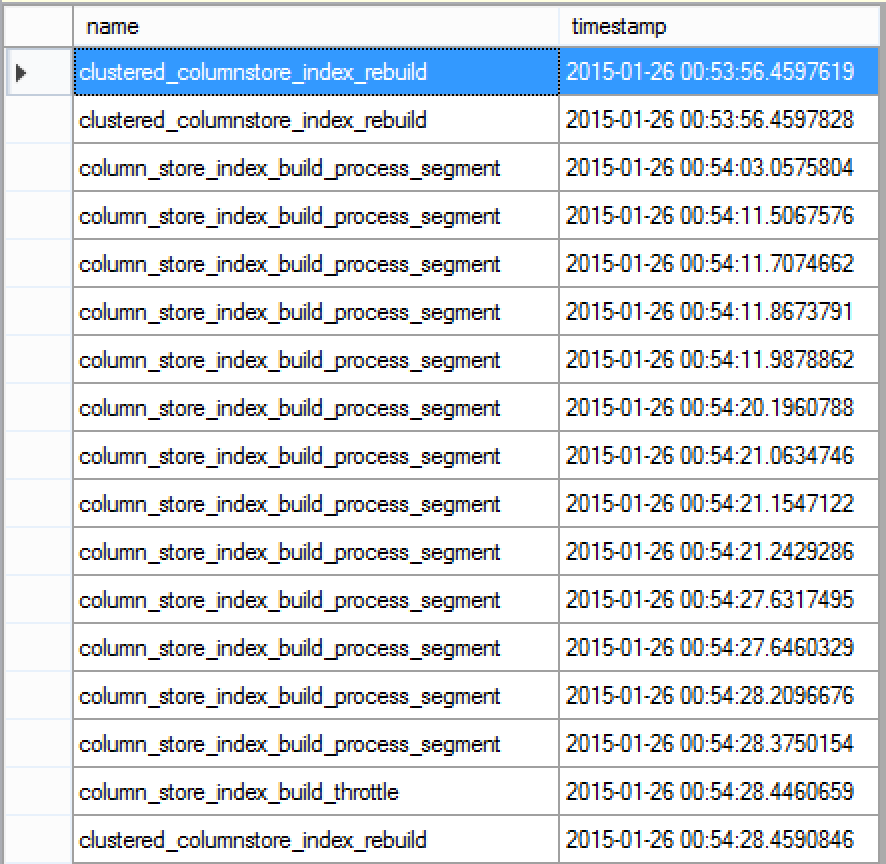
After finalising the execution and stopping the Extended Events Session, I have almost 2.000 events caught:
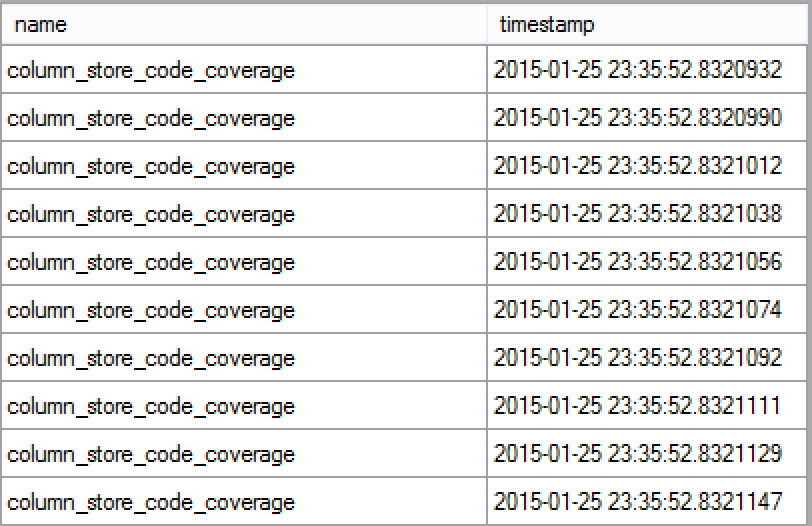 There will be quite a lot of information generated for this Extended Event Session, especially column_store_code_coverage_list will be delivering great amounts of information, as you can see on the picture on the left.
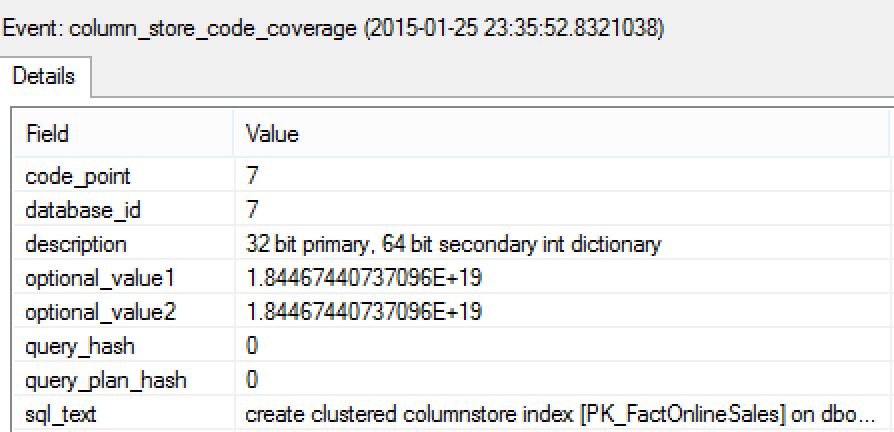 Consulting the details of any of the column_store_code_coverage caught event will give you debugging information and some amazing insights on how the dictionaries for Columnstore Index are being built – you will find some messages such as “Primary dictionary & secondary dictionary present” or “Only primary dictionary present”, which might be ultimately useful for some very deep troubleshooting, but I would say that only for the extreme support case you will need to look or to share this information, mostly because in vast number of cases you can simply do your job with amazing implementation that Microsoft engineers did and partly because of its amount and its complexity.
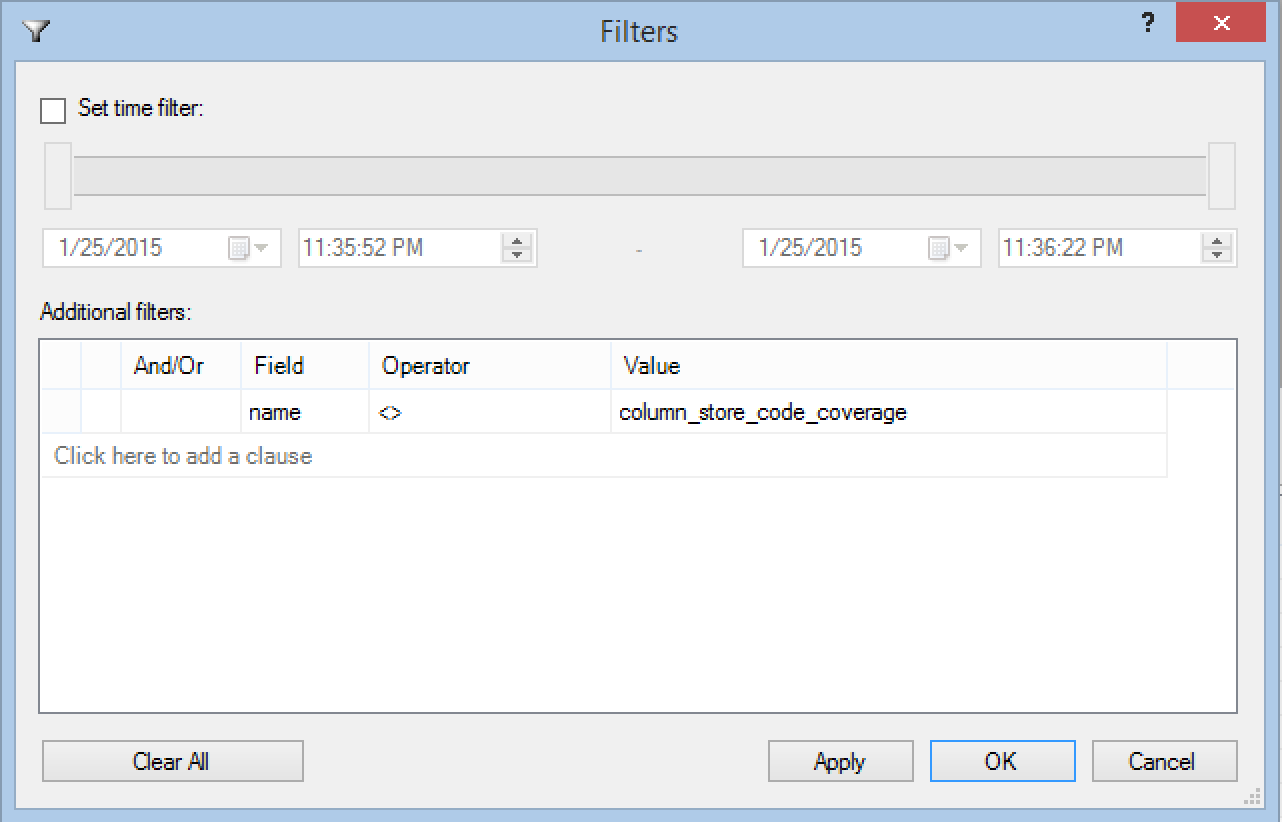 For ignoring this event, it is enough to add a filter, as I show on the picture on the left. The result will be the 13 segments that the Columnstore table will have plus an additional Throttling event, which will be considering right in a couple of lines below.
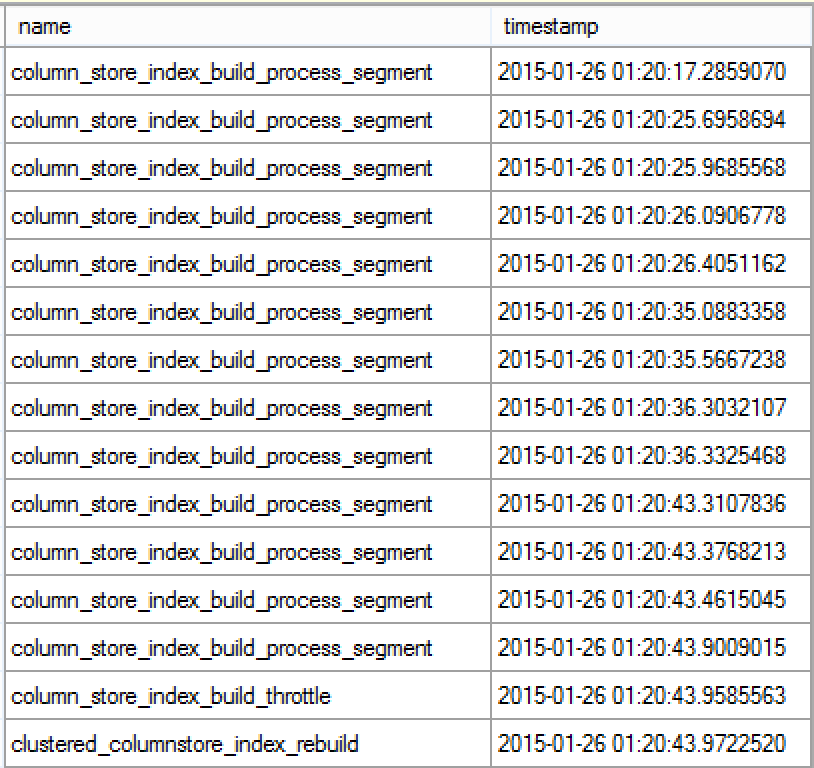
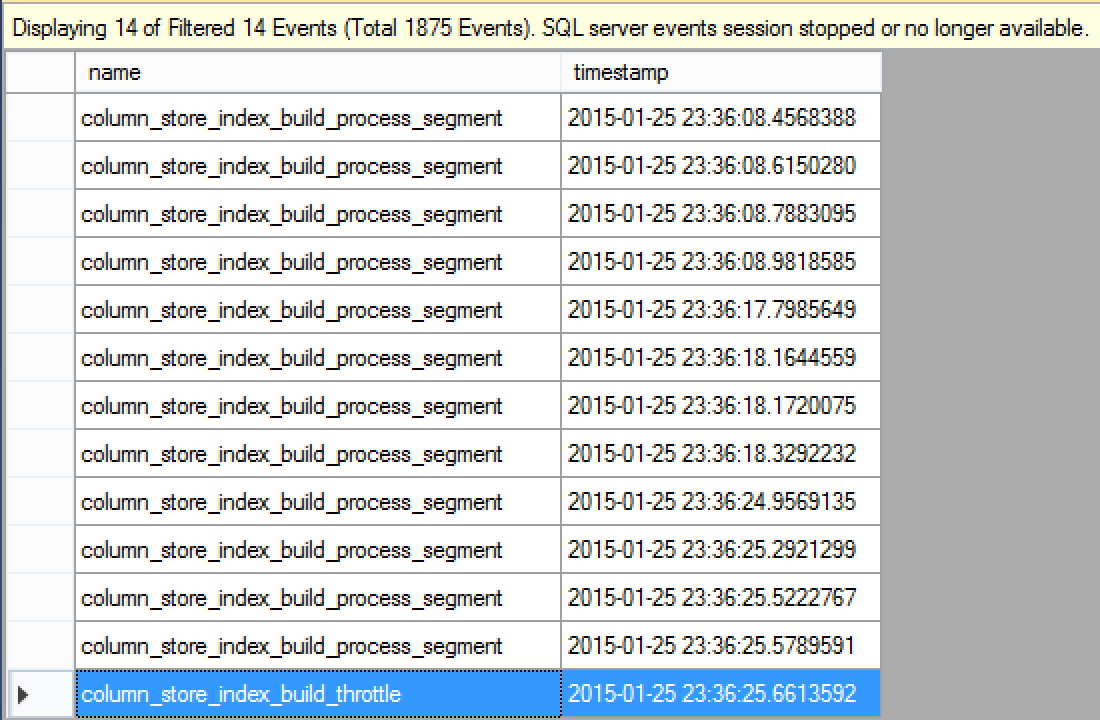 As you can see, the result is basically a list consisting of column_store_index_build_process_segment plus a single column_store_index_build_throttle event. One of the major uses that one can do is to do a count of the column_store_index_build_process_segment event for knowing the number of RowGroups present in respective Columnstore Index. For confirmation you can always run the following query:
select segment_id, row_count, base_id, min_data_id, max_data_id
	from sys.column_store_segments seg
		inner join sys.partitions part
			on seg.partition_id = part.partition_id
	where column_id = 1
		and part.object_id = object_id('FactOnlineSales');
You will see that there are 13 Segments with ids from 0 to 12.
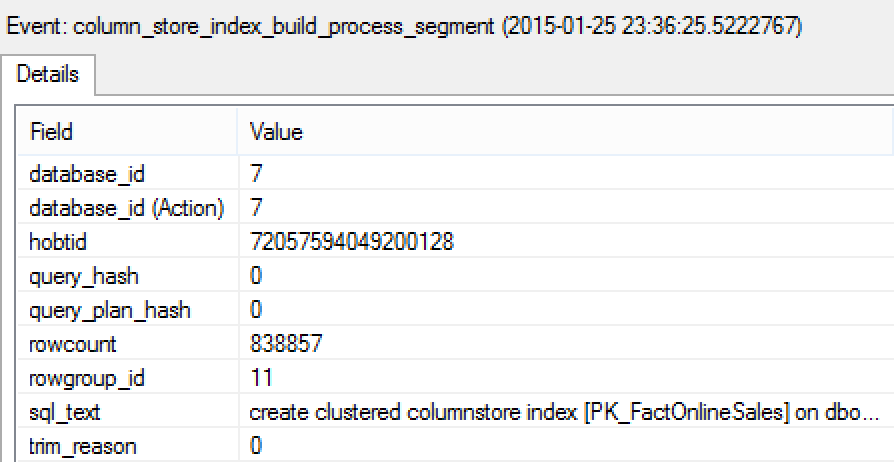 Consulting column_store_index_build_process_segment event will allow you to discover the same information but which is available almost in the real time, which is very important if you are running a process on a big table with hundreds of million rows. The property rowgroup_id will provide you with information on the RowGroup that is being processed and rowcount property shall reveal the number of rows that this particular RowGroup shall have.
Another very important property here is trim_reason which should detail the reasons for creating smaller Row Groups than the maximum allowed value (1048576 rows). The value for the reason is a numeric and it is not documented, but knowing possible reasons for trimming RowGroups (Memory Pressure, Dictionary Pressure, Not Enough Rows to create a full one, Rows unevenly spread between threads) – it would not be too hard to that.
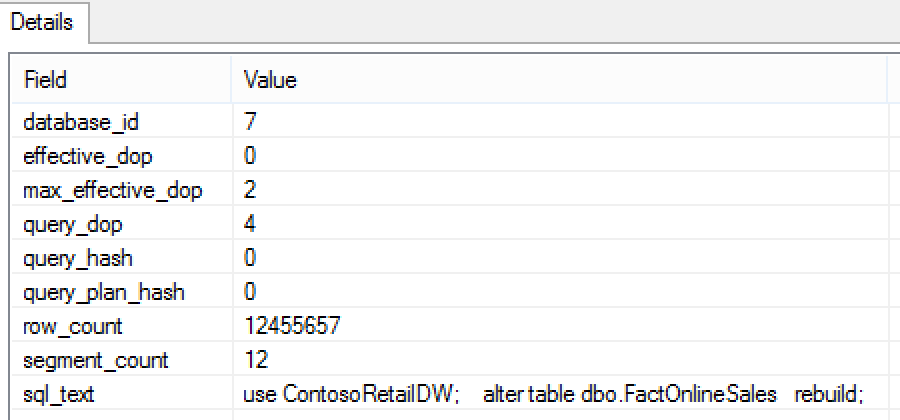
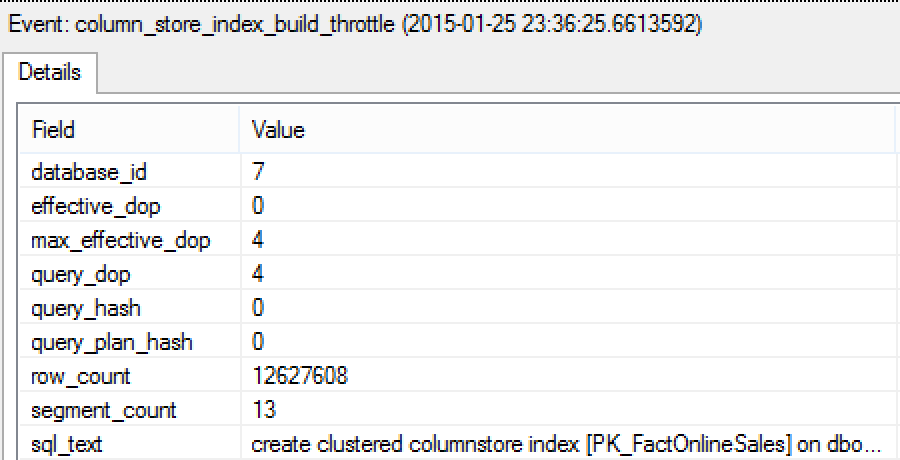 Consulting the column_store_index_build_throttle event will give you a small overview on the whole process and shows the performance reduction of the Columnstore Build process (should it have happen). In this case this message provides informational status on the number of threads (DOP) configured, used in a query and effectively being used in the process. Also such information as the total number of rows inside the table and the total number of Segments (RowGroups) created.
You might have noticed that the operation of index creation did not included clustered_columnstore_index_rebuild event – this is because I did not issued REBUILD operation – i simply created the index with dropping the existing one, and so the Rebuild process was not called and there are some important thing to consider: there are 2 ways to rebuild a columnstore index – first one is to call REBUILD on the whole table and the second one is to invoke rebuild process directly on the Columnstore Index.
Let’s invoke them both and see what is different:
alter table dbo.FactOnlineSales
	rebuild;
 Notice that we have only 1 clustered_columnstore_index_rebuild event, which is appearing in the end of the process and its providing information on the rebuild phase that includes upgrade to schema modification lock.
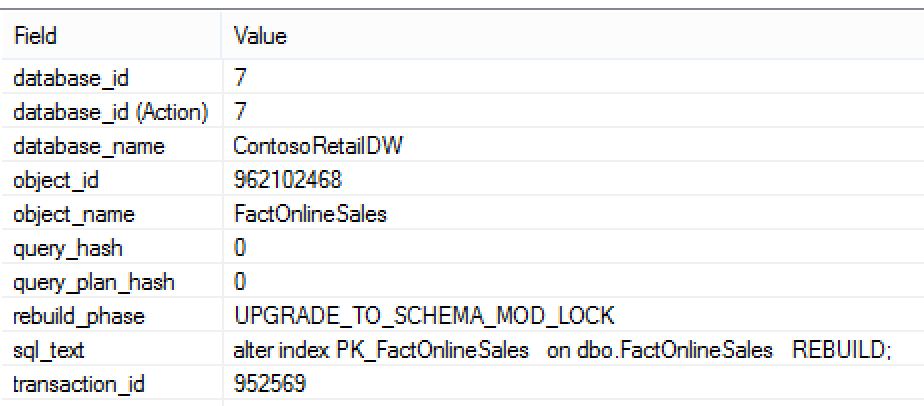 You can see on the picture at the side that actually there is not much information to add besides the previously written statement on what this rebuild phase does.
alter index PK_FactOnlineSales
	on dbo.FactOnlineSales
	REBUILD;
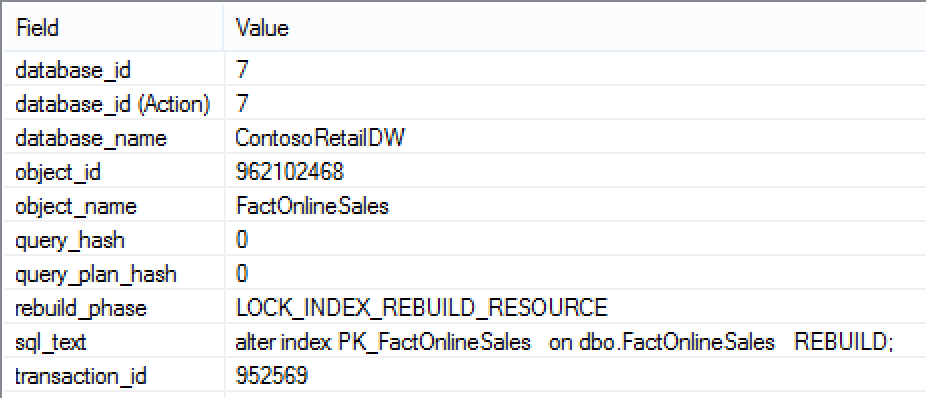
 Rebuilding index directly gives you 2 extra events in the beginning of the process: one for locking the table and other for locking the index itself (LOCK_INDEX_REBUILD_RESOURCE). I have not searched for the other events to solve the lack of locks for the table REBUILD command, but I am confident that they should exist in the vast space of the Extended Events.
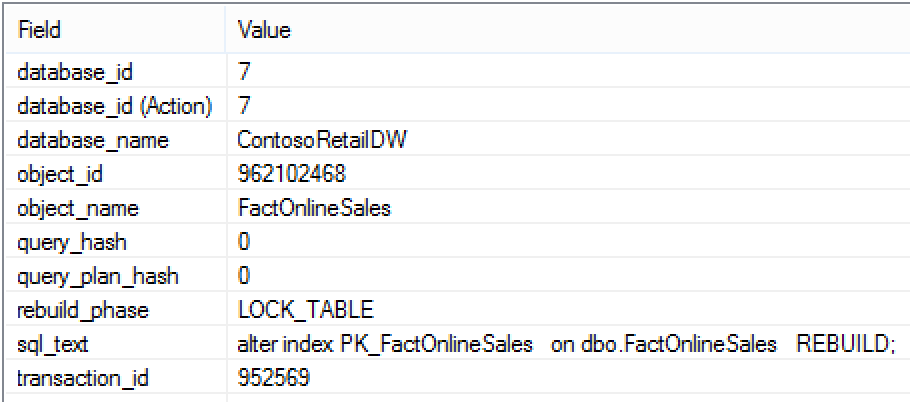 Consulting the properties of the both of the caught clustered_columnstore_index_rebuild event will show the lock that they acquired and nothing else pretty much useful from my point of view.
Whenever you are in trouble with memory, the event column_store_index_build_low_memory & column_store_index_build_throttle will point you to the right direction.
For this example I will use my pre-configured user, with a very limited ResourcePool associated in Resource Governor – basically I am creating a memory pressure, like in all those examples at the session at PASS Summit:
alter table dbo.FactOnlineSales
	rebuild;
Rebuilding our table this time will provoke a very long chain of found extended events:
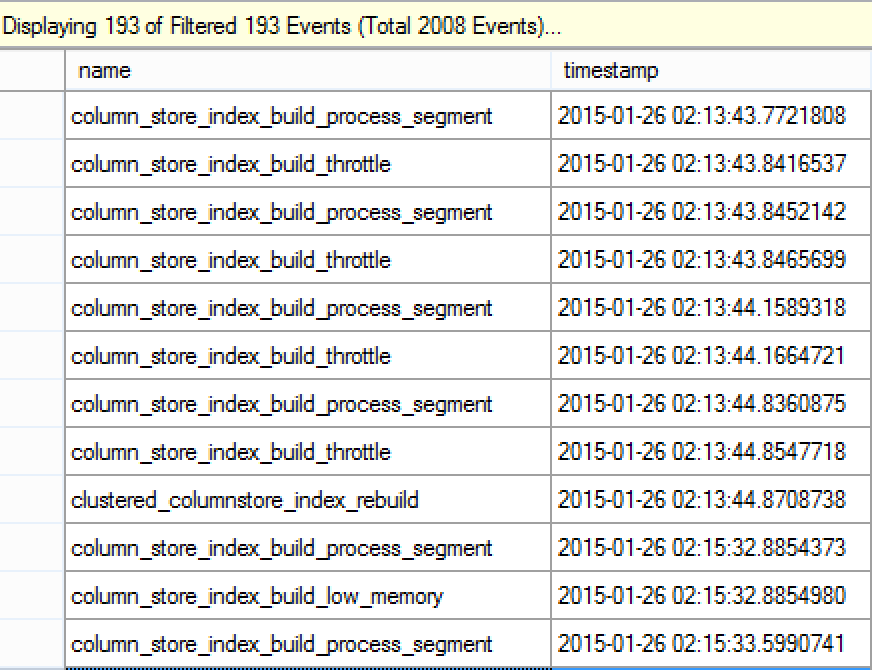 You can clearly observe that per each of my CPU cores (4), for the first events happening I have a conjunction of the column_store_index_build_process_segment & column_store_index_build_throttle events. Without further guessing I can easily understand that my rebuild process is being scaled down, since each of the core is about to get throttled by the system.
Further below I can see column_store_index_low_memory appearing which explains the appearance of the throttling notifications – I do not have enough memory for my Rebuild query and so with low amount of resources the Query Process has to lower the Degree of Parallelism.
 Consulting the information on the column_store_index_build_throttle event this time will provide me with details that my DOP has been lowered from 4 to 2.
Consulting any of the column_store_index_build_process_segment events will provide with the real number of rows that every RowGroup is getting – in my case they will be rounding 131.073 rows, almost 10 times smaller than the expected one.
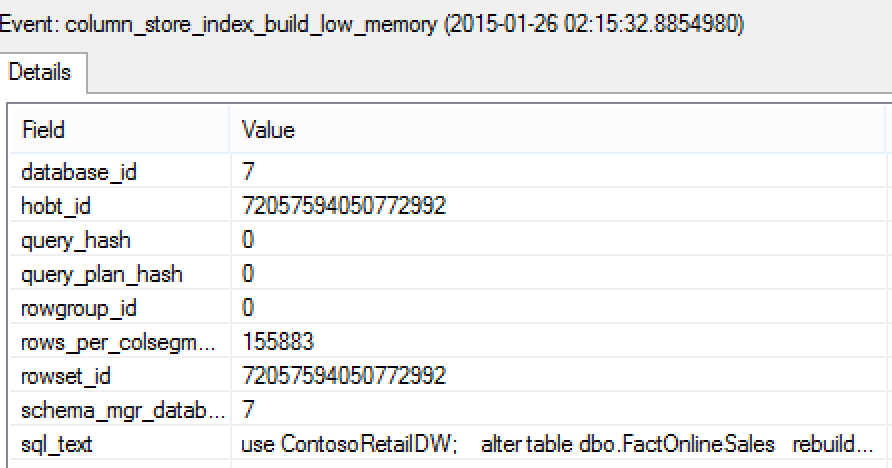 When consulting column_store_index_build_low_memory event, you can see the actual number of rows that every Segment Builder (column_store_index_build_process_segment) will have to work with and consequentially will allocate for the RowGroup. If you consult the previous column_store_index_build_process_segment event, you will see that it has built the RowGroup with the number of rows that were specified in column_store_index_build_low_memory event.
Tuple Mover
The Tuple Mover has 2 Extended events, as I described in the previous post on the Extended Events – columnstore_tuple_mover_begin_compress, columnstore_tuple_mover_end_compress. They help to identify what is going on with the Columnstore table after loading data.
Both of the events make part of the same process and so for the test I will monitor them together:
CREATE EVENT SESSION [CCI_TupleMover] ON SERVER
ADD EVENT sqlserver.columnstore_tuple_mover_begin_compress(
    ACTION(sqlserver.database_id,sqlserver.query_hash,sqlserver.query_plan_hash,sqlserver.sql_text)),
ADD EVENT sqlserver.columnstore_tuple_mover_end_compress(
    ACTION(sqlserver.database_id,sqlserver.query_hash,sqlserver.query_plan_hash,sqlserver.sql_text))
ADD TARGET package0.event_file(SET filename=N'C:\Temp\CCI_TupleMover.xel')
WITH (EVENT_RETENTION_MODE=NO_EVENT_LOSS,MAX_DISPATCH_LATENCY=5 SECONDS)
GO
For testing Tuple Mover, I shall create a test table, loading 1048577 rows into it. This will guarantee the presence of 2 Delta-Stores: 1 closed one with the maximum number of rows for a RowGroup – 1048576 and another Delta-Store shall be open, because it will have just one row. After loading the data I shall invoke Tuple Mover with Alter Index Reorganise statement.
create table dbo.BigDataTest(
	id int not null );

-- Create Columnstore Index
create clustered columnstore index PK_BigDataTest
	on dbo.BigDatatest;


-- Load 1 Full Segment into the Test Table
declare @i as int;
set @i = 1;

begin tran
while @i <= 1048577
begin
	insert into dbo.BigDataTest
		values (@i);

	set @i = @i + 1;
end;
commit;

-- Invoke Tuple Mover to compress open Row Groups
alter index PK_BigDataTest on dbo.BigDataTest
	reorganize;
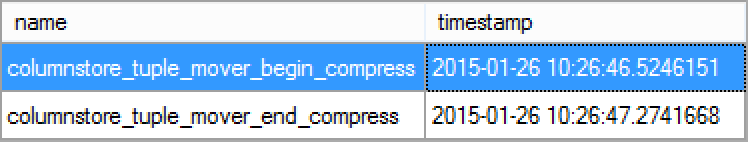 As you can see on the accompanying image, there are 2 events caught with this session - one for the begin of the Tuple Mover functionality and the other one marks the end of it.
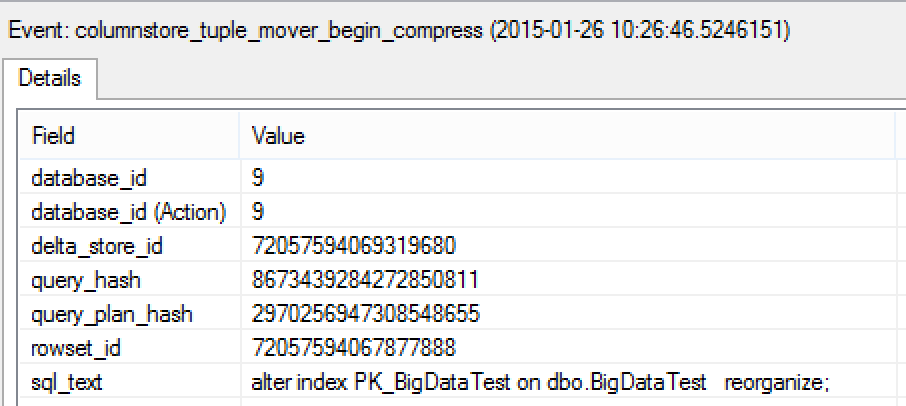 Consulting the details of both of the Tuple Mover events shall provide you an insight on the rowset_id (hobt_id from sys.column_store_row_groups) as well as the id of the Delta-Store that was compressed.
Note that using Reorganize with a hint forcing close of the open Delta Stores Reorganize with (COMPRESS_ALL_ROW_GROUPS = ON); will not be any different from the point of view of this Extended Events.
Columnstore Processing - Segment Elimination
The best way to observe Segment elimination is to follow the column_store_segment_eliminate session. It will help you to determine which RowGroups were eliminated by the executed query.
CREATE EVENT SESSION [column_store_segment_eliminate] ON SERVER
ADD EVENT sqlserver.column_store_segment_eliminate(
    ACTION(sqlserver.database_id,sqlserver.query_hash,sqlserver.query_plan_hash,sqlserver.sql_text))
ADD TARGET package0.event_file(SET filename=N'C:\Temp\column_store_segment_eliminate.xel')
WITH (EVENT_RETENTION_MODE=NO_EVENT_LOSS)
GO
This time I will use the following query to test the Extended Event Session functionality:
select sum([UnitPrice]) as Sales, max(DateKey)
	from dbo.FactOnlineSales
	where OnlineSalesKey >= 30120879 and OnlineSalesKey <= 32181089;
 Looking at the properties of one of the particular captured events, you can notice that this is the place where you can have the correct information about RowGroup that was eliminated (Hence the consideration that maybe we should actually call it RowGroup elimination instead of Segment Elimination), and the actual reference to the object (Columnstore Table) in question is a rowset_id, which is actually a hobt_id, that can be found in the sys.column_store_row_groups DMV.
Also notice that this session is quite "chatty" and if working with a big columnstore table, you might find a quite impressive number of events caught just as a result of a simple query.
Columnstore Processing - Reads & Read-Aheads
As we know, right now Columnstore Indexes are using traditional storage with pages of 8Kb, and for performance analysis it is important to be able to observe this behaviour.
Columnstore Indexes have a different reading implementation from the traditional indexes - even though stored as a blob in 8kb pages, its read-ahead functionality is much more "aggressive" than a traditional row-storage reading. A row-store read-ahead operation can get a maximum of 512kb read-ahead operation while a columnstore enjoys 16 times bigger limit - 8MB. (I will need to go into the details of the reading mechanism in one of the future posts)
For analysing the behaviour of the columnstore pages read & read-ahead operations I will setup a single Extended Event Session with both events:
CREATE EVENT SESSION [column_store_rowgroup_reads] ON SERVER
ADD EVENT sqlserver.column_store_rowgroup_read_issued(
    ACTION(sqlserver.database_id,sqlserver.query_hash,sqlserver.query_plan_hash,sqlserver.sql_text)),
ADD EVENT sqlserver.column_store_rowgroup_readahead_issued(
    ACTION(sqlserver.database_id,sqlserver.query_hash,sqlserver.query_plan_hash,sqlserver.sql_text))
ADD TARGET package0.event_file(SET filename=N'C:\Temp\column_store_rowgroup_reads.xel')
WITH (EVENT_RETENTION_MODE=NO_EVENT_LOSS,MAX_DISPATCH_LATENCY=5 SECONDS)
GO
This time my test query shall have no predicate, so I can truly force the system to use read-ahead operations:
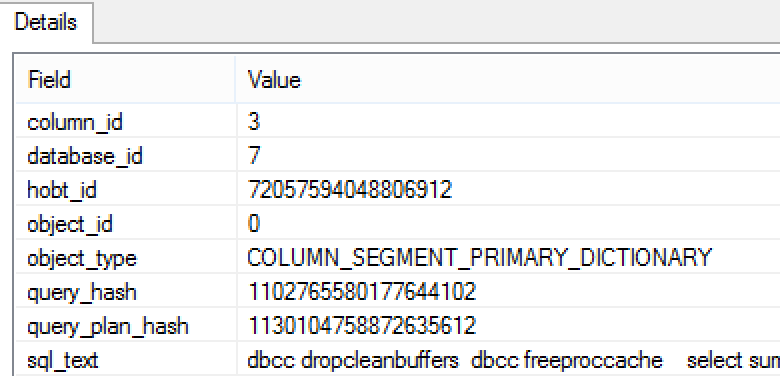
dbcc dropcleanbuffers
dbcc freeproccache

select sum([UnitPrice]) as Sales, max(DateKey)
	from dbo.FactOnlineSales
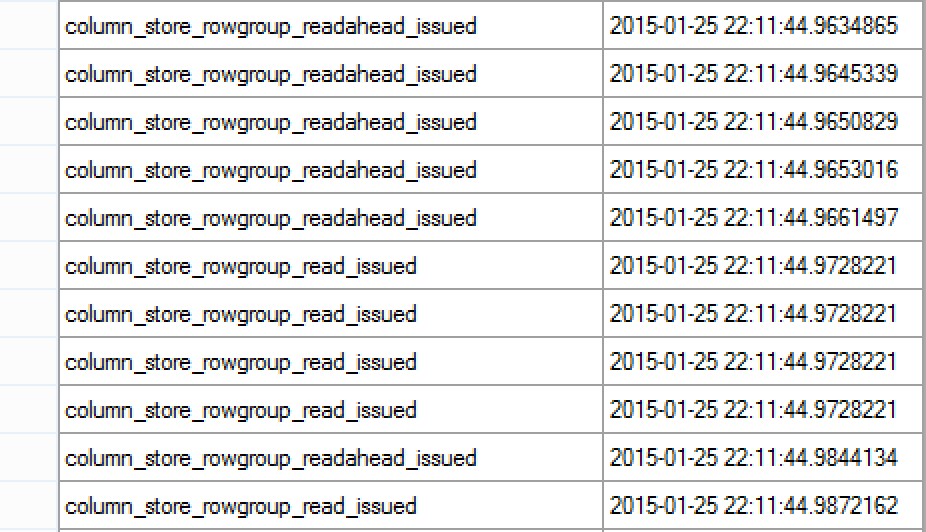 You can observe on the image on the left side that the first operations that I get are the read-aheads, this has to do with the internal functioning of the aggressive read-ahead mechanism for Columnstore indexes.
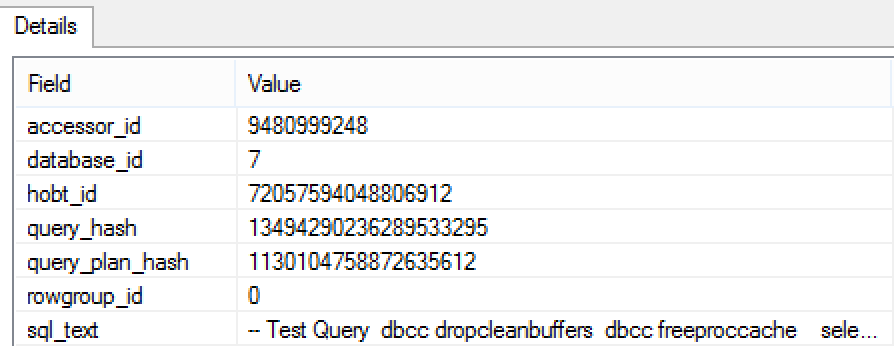 You can see on the details of each of the operations the RowGroup that is being read as well as the other informations that I have included for this test. One important notice goes here to the fact that hobt_id is correctly described for both of the events, not like for column_store_segment_eliminate event, where we have rowset_id.
Consistency is the point where Microsoft could do some improvements.
With new detailed additions to the execution plans in Azure SQLDatabase, we have great information on the SegmentReads & SegmentSkips, and so I am expecting in the next version of SQL Server it to become available, but the debugging of which individual RowGroups were read and skipped will be the mission that will have to be completed with the Extended Events.
Batch Mode
Batch Mode is one of the key functionalities of the Columnstore Indexes, accelerating the processing in 10s and sometimes in 100s of times. Extended Events can provide an unprecedented insight into Batch Mode functionalities.
While analysing Batch Mode Extended Events, it makes a lot of sense joining all the 5 events together in 1 session and so here is my setup. (Once again, some of the settings used here are unsuitable for production):
CREATE EVENT SESSION [BatchMode] ON SERVER
ADD EVENT sqlserver.batch_hash_join_separate_hash_column(
    ACTION(sqlserver.database_id,sqlserver.query_hash,sqlserver.query_plan_hash,sqlserver.sql_text)),
ADD EVENT sqlserver.batch_hash_table_build_bailout(
    ACTION(sqlserver.database_id,sqlserver.query_hash,sqlserver.query_plan_hash,sqlserver.sql_text)),
ADD EVENT sqlserver.query_execution_batch_hash_aggregation_finished(
    ACTION(sqlserver.database_id,sqlserver.query_hash,sqlserver.query_plan_hash,sqlserver.sql_text)),
ADD EVENT sqlserver.query_execution_batch_hash_children_reversed(
    ACTION(sqlserver.database_id,sqlserver.query_hash,sqlserver.query_plan_hash,sqlserver.sql_text)),
ADD EVENT sqlserver.query_execution_batch_hash_join_spilled(
    ACTION(sqlserver.database_id,sqlserver.query_hash,sqlserver.query_plan_hash,sqlserver.sql_text))
ADD TARGET package0.event_file(SET filename=N'C:\Temp\BatchMode.xel')
WITH (MAX_MEMORY=4096 KB,EVENT_RETENTION_MODE=NO_EVENT_LOSS,MAX_DISPATCH_LATENCY=5 SECONDS,MAX_EVENT_SIZE=0 KB,MEMORY_PARTITION_MODE=NONE,TRACK_CAUSALITY=OFF,STARTUP_STATE=OFF)
GO
For the beginning, I will use a very simple query:
select sum([UnitPrice]) as Sales
	from dbo.FactOnlineSales
	where OnlineSalesKey >= 27120879 and OnlineSalesKey <= 32181089;
![]() On the list of the caught events, you will find query_execution_batch_hash_aggregation_finished event, marking the end of the "Hash Match(Partial Aggregate)" iterator execution, that can be found in the execution plan of this query.
On the list of the caught events, you will find query_execution_batch_hash_aggregation_finished event, marking the end of the "Hash Match(Partial Aggregate)" iterator execution, that can be found in the execution plan of this query.
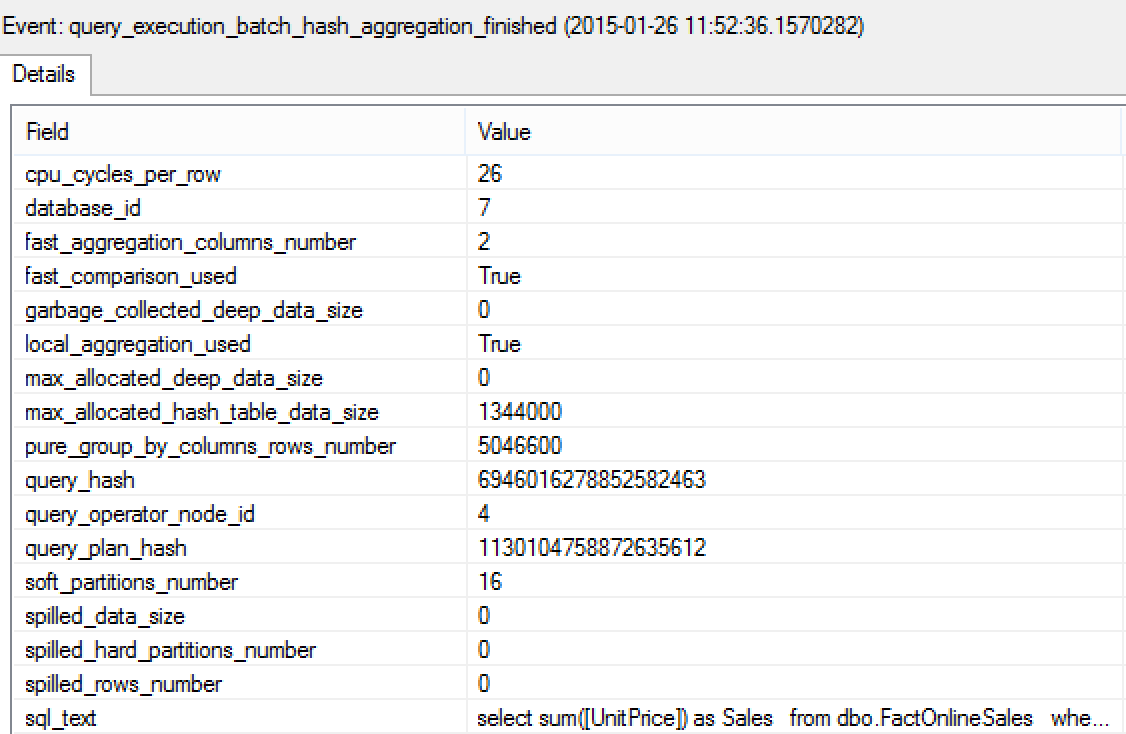 There is quite a lot of interesting internal details if we consult the properties of the query_execution_batch_hash_aggregation_finished event:
- cpu_cycles_per_row - the number of CPU cycles used per row while executing this operation. This property can lead to better understanding if what we do to our query is improving overall performance or not. A lot of times it will have to do with the size of data flowing into the SIMD registers - the smaller row is, the more rows can fit into the same space and hence can be worked on at the same time.
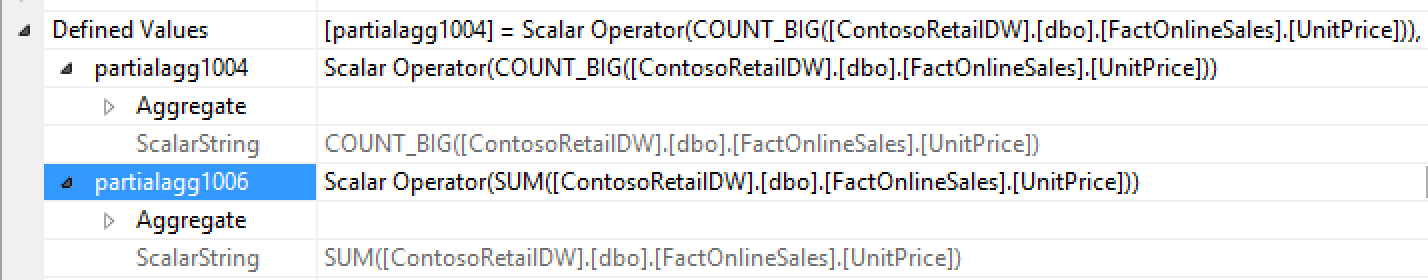
- fast_aggregation_columns_number - 2. This makes sense, since the our Partial Aggregation is doing 2 internal aggregations - SUM & COUNT_BIG, as can be seen on the accompanying picture. This is a standard practice for such operations.
- fast_comparison_used - Unknown.
- garbage_collected_deep_data_size - Unknown
- local_aggregation_used - Indicates whether the aggregation that was Local or Global.
- max_allocated_deep_data_size - Unknown
- max_allocated_hash_table_data_size - the maximum size of the Hash Table that was allocated.
- pure_group_by_columns_rows_number - Unknown. (I have seen the same query using this property in a number of ways).
- soft_partitions_number - number of software partitions used in a hash function. Partitioning in hash functions is used to speed up lookup operations. Unconfirmed.
- spilled_data_size - amount of data stored in TempDB, should Hash Spill happen. (Not enough memory for the process to finalise in memory)
- query_operator_node_id - Id of the iterator in the execution plan that was monitored. This is awesome for the complex plans where a lot of different Hashing functions are being used.
- spilled_hard_partitions_number - number of partitions spilled into TempDB. I am trying to find out what those hard_partition means and what is the difference to the soft_partition (I am assuming that soft_partition is a Software Partitioning, but need to confirm that).
- spilled_rows_number - the number of rows written into TempDB as a result of Spill process.
For analising Hash Spills, you can use the query_execution_batch_hash_join_spilled event, for which I shall execute the following script on my pre-configured user that has a very low memory limit associated in Resource Governor:
set rowcount 1000

select sales.OnlineSalesKey, COUNT_BIG(*)
	from dbo.FactOnlineSales sales
		inner join dbo.FactOnlineSales sales2
			on sales.OnlineSalesKey = sales2.OnlineSalesKey
	group by sales.OnlineSalesKey
	order by sales.OnlineSalesKey;
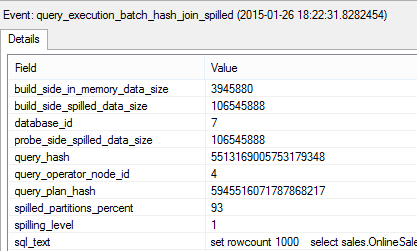 On the details of this event you will find a number of interesting informations such as the size of Build Side of the Hash Function (build_side_in_memory_data_size), the amount of memory spilled into TempDB (build_side_spilled_data_size) - in this example the amount of memory spilled into TempDB is huge compared to the one fit into memory, the Probe Side size that was spilled into TempDB (probe_side_spilled_data_size), the percentage of the partitions spilled (Soft? Hard?) (spilled_partitions_percent) - anyway this property definitely points that the amount of data spilled was tremendous compared to the part fit into memory, and also the spilling level is included here.
There are different types of spilling of Hash functions (Build Side, Probe Side, Both) and those details will help you understanding what was going on.
Reading Columnstores
For analysing the reading behaviour of Columnstore Indexes we can use different dmv's that will provide us with some very useful information. I have described them in Clustered Columnstore Indexes – part 38 (“Memory Structures”) as well as in the Clustered Columnstore Indexes – part 39 (“Memory in Action”) blogposts.
We can discover quite a lot of interesting information contained in the memory, especially if we dive into sys.dm_os_buffer_descriptors dmv, we can truly discover what has been read & what's not, but this information in the real time is almost impossible to filter. On the server having a lot of activities and queries running, we must use a different approach if we want to find out which segments have been processed directly from the memory and which were absent from the RAM and so we read from disk into memory first.
At the current SQL Server version (2014) we have 2 nice Extended Events that help us to understand this problematic – the column_store_object_pool_hit & the column_store_object_pool_miss. The first one will appear every time we manage to read the data from the memory and the second one will appear when Columnstore Segment, Dictionary or Deleted Bitmap, useful for the query are not present in memory.
I will create an Extended Events session that will have just the column_store_object_pool_miss event,
and just for the test (PLEASE DO NOT USE THIS FOR PRODUCTION), I have configured storing the extended events in the .xel file in C:\Temp folder with just 5 seconds of latency and a number of different actions that I consider useful for the test - Query Hash, Query Plan Hash, SQL Statement Text.
CREATE EVENT SESSION [column_store_object_pool_miss] ON SERVER
ADD EVENT sqlserver.column_store_object_pool_miss(
    ACTION(sqlserver.query_hash,sqlserver.query_plan_hash,sqlserver.sql_text,sqlserver.tsql_stack,sqlserver.username))
ADD TARGET package0.event_file(SET filename=N'C:\Temp\column_store_object_pool_miss.xel')
WITH (MAX_MEMORY=4096 KB,EVENT_RETENTION_MODE=NO_EVENT_LOSS,MAX_DISPATCH_LATENCY=5 SECONDS,MAX_EVENT_SIZE=0 KB,MEMORY_PARTITION_MODE=NONE,TRACK_CAUSALITY=OFF,STARTUP_STATE=OFF)
GO
After setting up the Extended Event Session, I have started it and the pictures that I am showing below are reflecting the captured data.
Now I am ready to run the test query:
dbcc dropcleanbuffers
dbcc freeproccache

select sum([UnitPrice]) as Sales, max(DateKey)
	from dbo.FactOnlineSales
	where OnlineSalesKey >= 30120879 and OnlineSalesKey <= 32181089;
And this is what I was able to see after the execution:
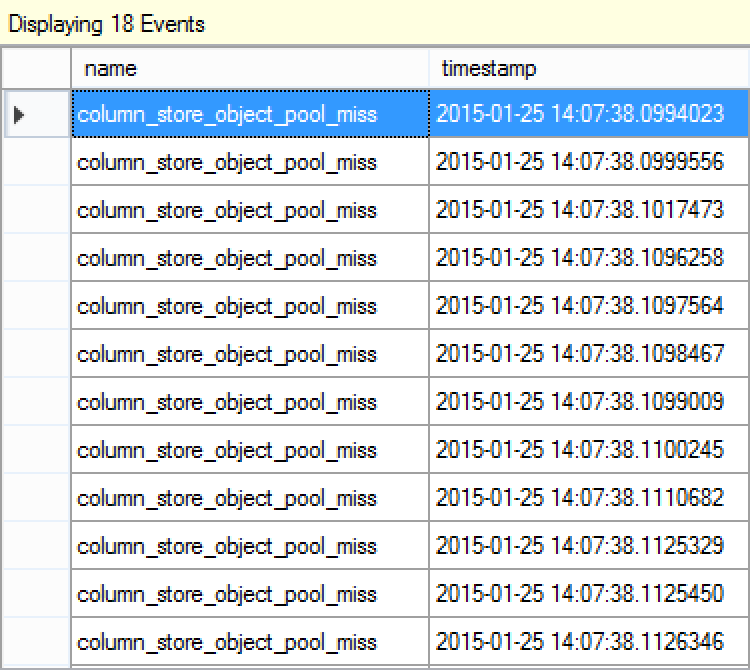 I have received a number of Columnstore Object Pool misses, which is expected, since I have cleaned it using "DBCC DropCleanBuffers" command. With an empty Columnstore Object Pool, the processing of Columnstore Index structure involves reading every single Segment with corresponding Deleted Bitmap, as well as the existing Dictionaries.
Scrolling through captured events you will find different structures missing from the Columnstore_Object_Pool and subsequently being loaded into the memory - and you can discover a number of important details once you start doing real troubleshooting.
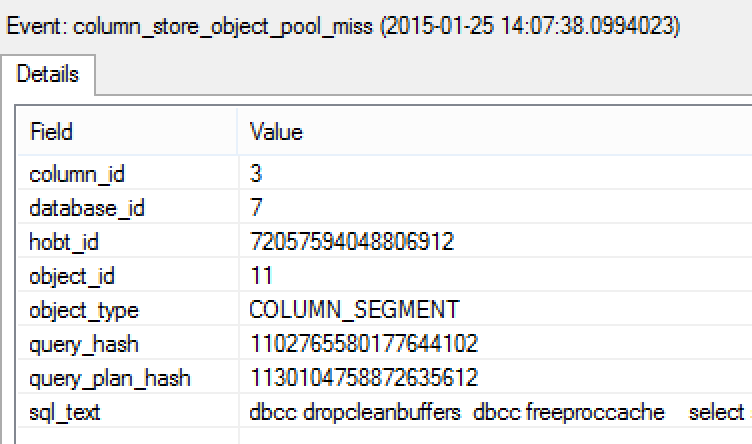 Whenever Query Processor is needing a segment that is not loaded, you can easily discover which RowGroup and which column are being processed, you can also identify the query and its execution plan and so troubleshooting becomes more accessible.
 Notice that Deleted Bitmaps are also being loaded into memory and for the Column_Segment_Delete_Bitmap event we can notice that column_id does not store any information related to the column, at least from the logical sense.
 The primary dictionary (also known as the global dictionaries, id = 0 in the sys.column_store_dictionaries dmv) are naturally associated with concrete columns are being fetched into memory for decompression.
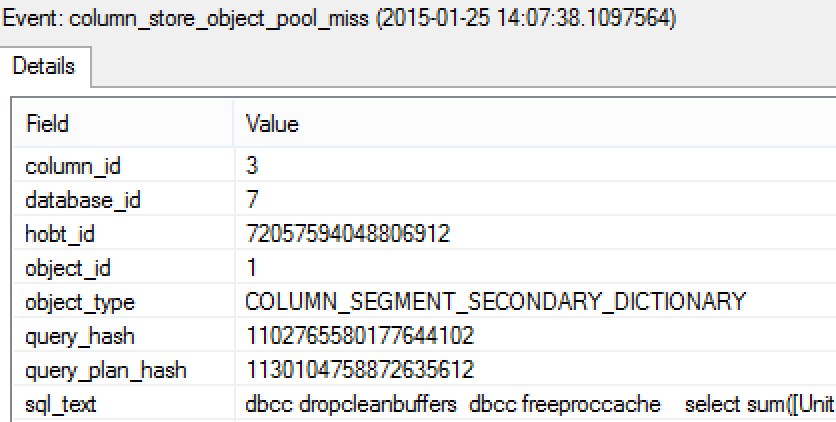
 The Secondary dictionaries (or alternatively local dictionaries, id > 0 in sys.column_store_dictionaries dmv) are also present in this Extended Event session, they are associated with a specific RowGroup and Segment.
The same properties are applicable to the column_store_object_pool_hit Extended Event Session. This one is showing information whenever Query Processor is using a Segment, Deleted Bitmap or any of the Dictionaries directly from the main memory, without resorting to the disc drive access.
Here is a definition of the column_store_object_pool_hit Extended Event Session (warning - these setting should be used only in test environment):
CREATE EVENT SESSION [column_store_object_pool_hit] ON SERVER
ADD EVENT sqlserver.column_store_object_pool_hit(
    ACTION(sqlserver.database_id,sqlserver.query_hash,sqlserver.query_plan_hash,sqlserver.sql_text))
ADD TARGET package0.event_file(SET filename=N'C:\Temp\column_store_object_pool_hit.xel')
WITH (EVENT_RETENTION_MODE=NO_EVENT_LOSS,MAX_DISPATCH_LATENCY=5 SECONDS)
GO
Hope that this information shall help you to start monitoring your Columnstore Indexes.
This is not a complete blog post, since some of the events are extremely difficult to catch by example, whenever I will find a good demo - I shall update this blog post.
to be continued with Clustered Columnstore Indexes – part 48 (“Improving Dictionary Pressure”)
SIMD: You you sure it is using SIMD at all? You could find out by attaching the VS debugger and pausing 10 times in a row. Did it ever hit SIMD code? If not SIMD is not in the hot path at all.
Also, smaller rows would not translate to more rows in the same SIMD registers. There usually is a SIMD register per *column*, not per row. SIMD registers require uniform data and operations.
Great questions, tobi!
Until the moment you commented, I was positively sure that I have seen in multiple sources that SQL Server is using SIMD – but since I can’t find it fast, I will need to research this better.
I will revisit this topic in one of the upcoming posts.
Regarding the smaller rows – I stand corrected.
Thank you for very valuable comments!
Best regards,
Niko Neugebauer