This is the third blog post in the series dedicated to the Network Graph Analysis Tool – NodeXL.
If you are interested, you may find the very first post at the first blog post of the NodeXL series and the whole series at once are listed at NodeXL Series.
In this blog post I will show how to get some basic data from Twitter and how to work with them.
As I have explained in the previous post, getting data from connected Networks is extremely easy – you simply do not have to have any IT knowledge.
NodeXL Basics Step by Step
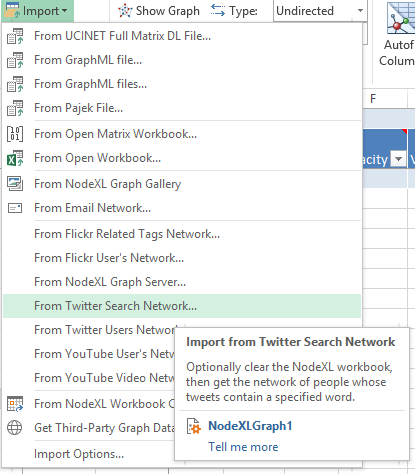 In this exercise I will import some data from the #sqlpass hashtag on Twitter. To begin I will need to open my NodeXL Template file (see part 1 in this series to find out how to do that), and select “NodeXL” ribbon. After selecting the right ribbon I will click on the “Import” button at the top left corner of the top menu as shown on the picture.
There are a number of different importers to select from, but for this example I will choose “From Twitter Search Network”, because it will allow me to search and create network of Twitter users who are including specific hashtag #sqlpass in their public twitter messages.
Try and explore other importers – those that I have seen and tried all appeared to be extremely easy to use and configure, which is a point of any good software.
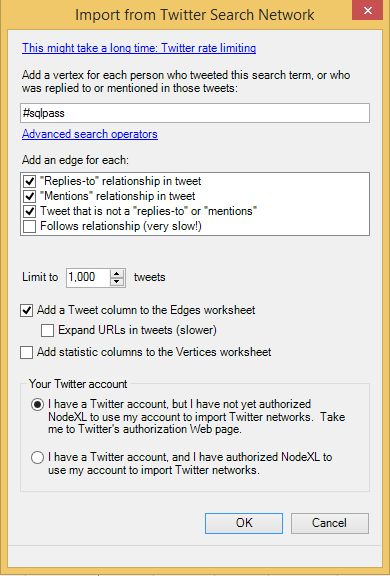 After selecting the importer you will face the option screen where you will need to specify a number of options, such as:
– Twitter search term: #sqlpass in our case. If you will not include the #(hash) sign in the search term, than you will look for any usage of this term in the Twitter messages and thus you might find someone who is not part of the network, or from other side you will find those people who might be typing too fast and simply forgetting their hash tags.
– Replies-to: select this one, since we want to record the communications between different people talking on the selected matter.
– Mentions: same logic for this exercise, we need it.
–Â Tweet that is not a “replies-to” or “mentions”: Yeap, pick it. Actually these are the default options which you are very safe to follow for the beginning.
–Â Follows relationship – Lets ignore it for the time being, since it will slow down data collection and potentially put us into position where we reach the limits of what Twitter wants to share with us.
– Limit to: This is where we can put some better numbers, and I definitely want to explore a network bigger than just 100 tweets – and so I put 1000 for this sample.
Important Note:
Twitter is not willing to share every bit of information and so there are a lot of important limits, such as: unless a tweet is favourited, you will not be able to find it after 7-8 days; You are also limited with around 1800 Twitts per day and around 15000 per week. Should you reach one of those limits you will notice that Twitter will not return data and you will have to wait for a some time before searching again.
A couple of years ago there was a “Whitelisted Developer” program at Twitter, but to my knowledge it was ended a long ago (over a year, and I am writing right now in May of 2014).
– Add a Tweet column , – Add statistic columns to Vertices: ignore those options for the very beginning, unless you want to explore statistics or are looking into some kind of more advanced analysis.
– Your Twitter account: First time you are using NodeXL, you will need to get an authorisation for using your account from within application and so you will need to select “I have a Twitter account” option as shown on the screenshot.
Authorizations between NodeXL & Twitter
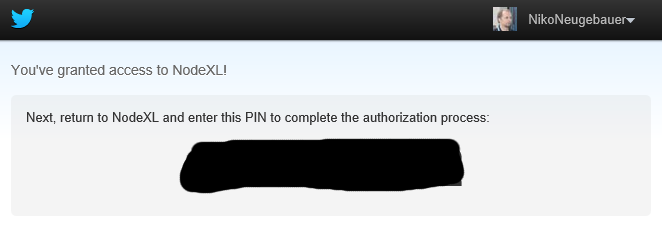 You will be taken to the following screen at twitter website, where after logging in, you will be presented with a sequence consisting of 7 numbers which you will need to copy/write down so you can give them back to NodeXL when asked.
This whole process is very easy and requires no additional understanding or knowledge. If you do not have a Twitter account and want to collect Twitter data, than you will need to create one.
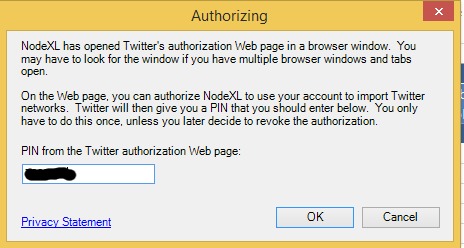 Going back to NodeXL I am copying this 7 numbers into authorisation screen as shown on the picture and after that we shall be good to proceed with collecting data from Twitter.
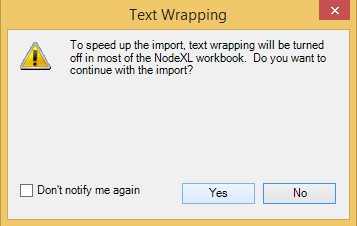 At this point you will see the progress of NodeXL importer getting the information from Twitter, page by page. Once all the information has been collected (if you will put some popular or broad terms you might have to wait for some time before finalising your data collection), you will be presented with the following message on the matter of Text Wrapping, on which I always answer YES, because I want my collected data to be imported into NodeXL. :)
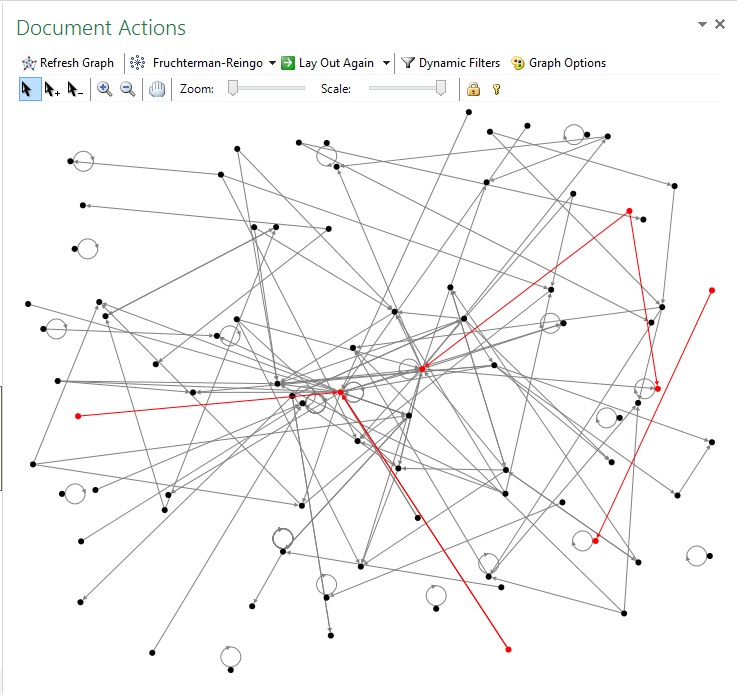
At this point basically you are done with your Extract & Load processes, and you can proceed to visualisation. If you are a bit more advanced user, you might be looking into transforming, adding or calculating some of the data, but for the current blog post I don’t want to mess with it.
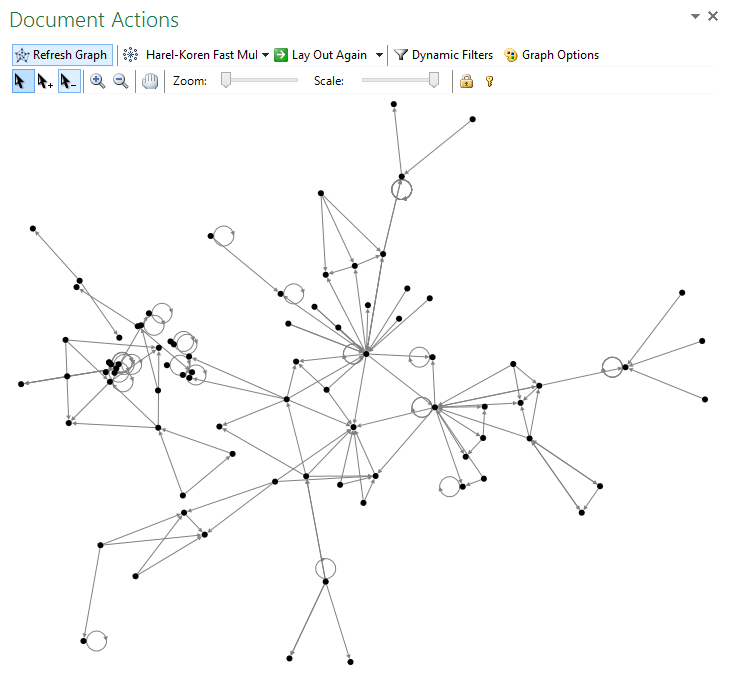
Simply go to the Document Actions Panel and click on the “Refresh Graph” button – here you are with you very first graph:
NodeXL Recipes:
You might be disappointed, since it looks way to simple and there are no whistles and blows as you have seen in other visualisations, and so you really want to have a fast recipe of how to improve it.
At this point ask yourself a question – how would you like it to look like? Take a look at the NodeXL Graph Gallery and pick a couple of the visualisations that you enjoy and you want to have your data presented with.
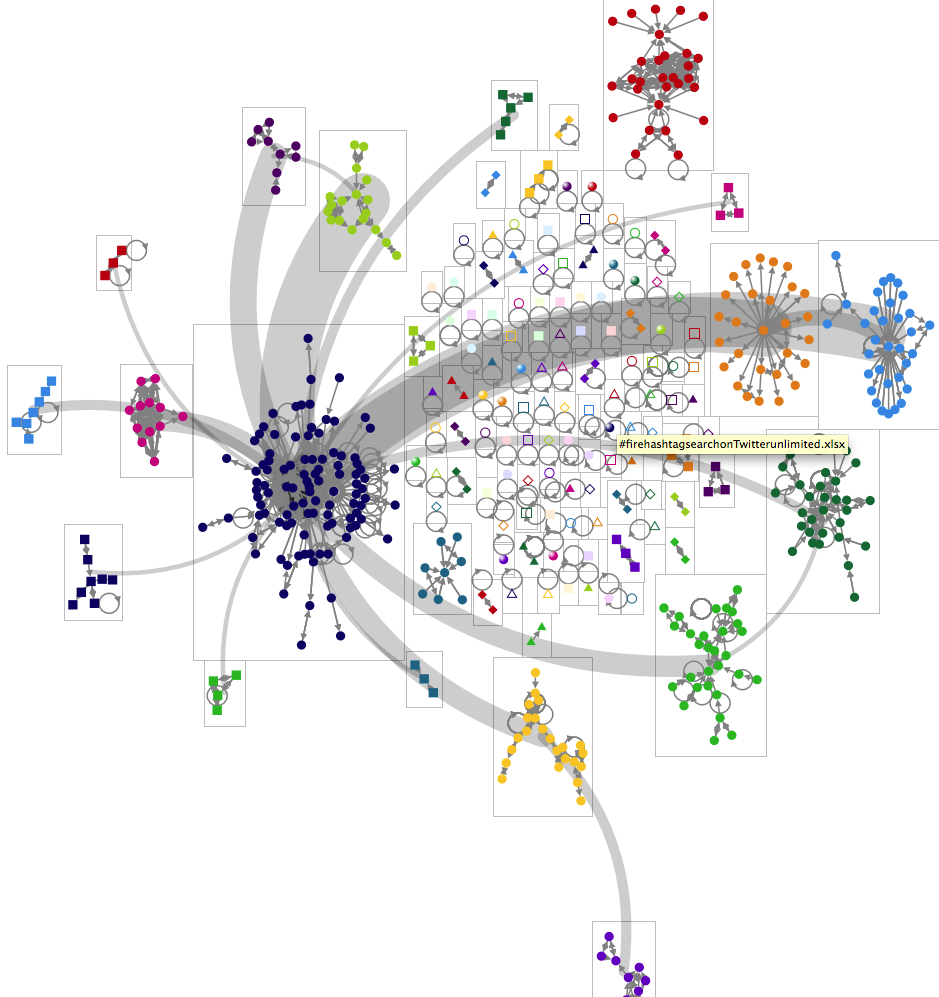
Let us see some concrete example – like that:
Well there is a small but nice trick of implementing it in just a couple of clicks. :)
Important Note: In order to have similar visualisations to some of the graphs at the NodeXL Graph Gallery, you will need to have similar data with exact properties. That being said, I simply recommend to try it out.
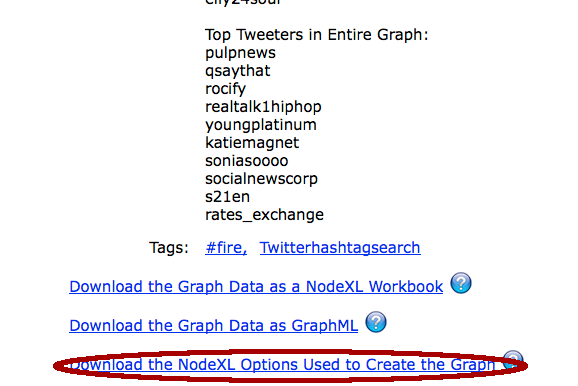 So how do we actually transfer that graph options into our imported data ? Very simple – since at the very bottom of the page there is a special link, called Download the NodeXL Options Used to Create the Graph as shown on the picture on the right. Simply click it and then download the file with .NodeXLoptions extension.
 After that simply click on the Import button on the Menu (located at the right-venter) and select the downloaded file. It will be simply imported into your NodeXL file. All you will need to do is to go back to the Document Actions panel and click on the Refresh button. Looks better, isn’t it? :) Still it is not quite what we were looking for …
There is something still missing, which is grouping. We did not group our Vertices yet and so we need to do this homework. Let us use all the default options and just execute the grouping to see if our situations improves.
NodeXL Grouping:
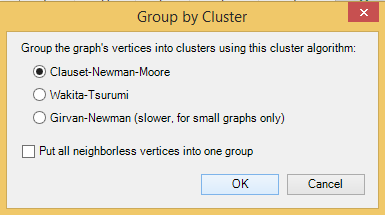
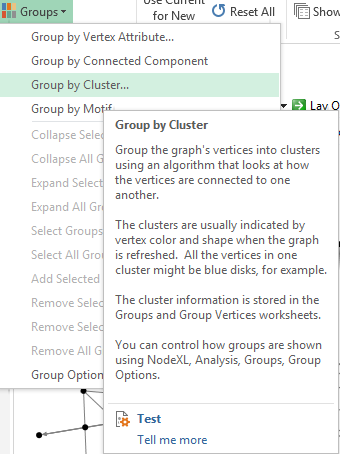 Click on the Groups button at the central Analysis menu and you will be taken to the next screen where you will be able to select Clustering algorithm. Leave everything by default and after a couple of seconds (depending on your computer) you will see a number of Groups created at the Groups worksheet.
After that go back to the Document Actions panel and click again on the Refresh button, you should have a similar visual result, which of course will depend on the number of the factors such as the original data that you import from Twitter, for example. :)
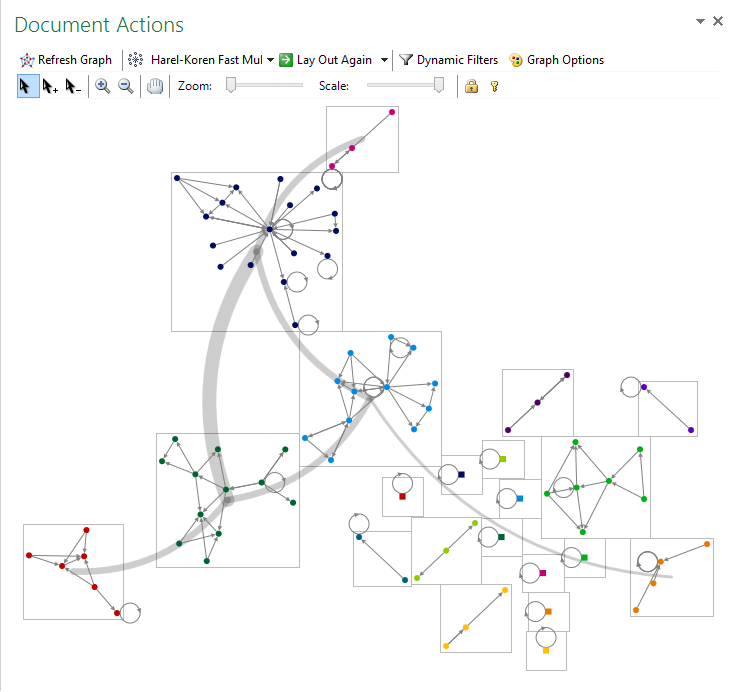
Our imported visualisation all done in under 2 minutes
You might be interested in playing with the settings in order to see different results, and basically from this point it is all up to you.
Enjoy analysing! :)
to be continued …