Carrying on with the Azure Synapse series on the workload identification, classification and isolation started with
Query Identification in Azure SQL DW (Synapse Analytics), in this post I wanted to focus on the workload groups and the workload isolation (aka Resource Governance).
Before advancing and looking into Azure Synapse Analytics “Resource Governor” (my own naming, my fault – and yeah, I shall keep it naming properly), we need to look at the resource classes in Azure Synapse Analytics.
But even before that et me start with WTH – Where is the Heck of Resource Governance in Azure SQL Database ? (Don’t throw at me those Managed Instances, which is a SQL Server with Availability Group running in tuned VM in the background – I want & need the Azure SQL Database to have the proper Resource Governance.
Resource Classes
In Azure Synapse Analytics we have Resource Groups (Database Roles) that are called Resource Classes, those are the groups that will help you to manage the resource distribution and
By default there are 2 classes of resources – Static & Dynamic.
Static Resource Classes
These are the resource classes that occupy a fixed (STATIC) percentage of the resources independently of the used Azure Synapse Analytics tier.
The static resource classes are implemented with these pre-defined database roles:
staticrc10, staticrc20, staticrc30, staticrc40, staticrc50, staticrc60, staticrc70, staticrc80 – where the number will stood for the maximum percent of memory that will accessible to each of the resource classes for the generation 1 of SQL DW, if my memory serves me right at this point. You will have to check the respective DMVs (sys.workload_management_workload_groups, sys.dm_workload_management_workload_groups_stats, sys.dm_pdw_nodes_resource_governor_workload_groups & sys.dm_pdw_nodes_resource_governor_resource_pools if you want to see stuff even on the node level).
Dynamic Resource Classes
The dynamic resource classes are implemented with these pre-defined database roles:
smallrc, mediumrc, largerc, xlargerc
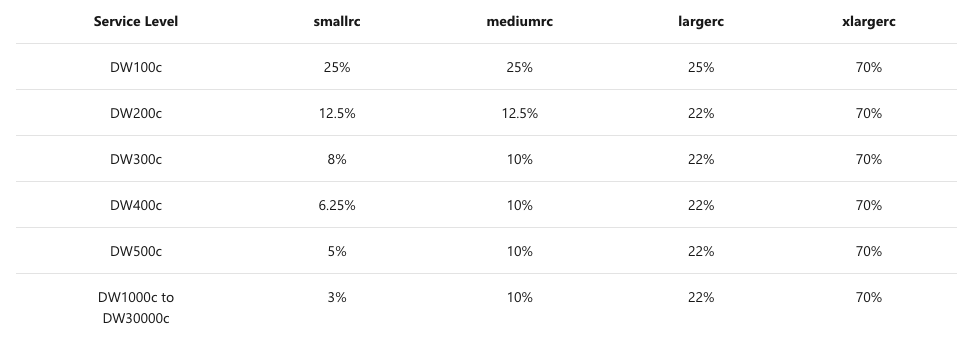 The picture on the left shows the distribution of the dynamic resources for each of the currently available Azure Synapse Analytics tiers, and was taken from the official documentation https://docs.microsoft.com/pt-pt/azure/synapse-analytics/sql-data-warehouse/resource-classes-for-workload-management. Indeed the smaller tiers up to DW500c are using just a single core, and so the rule of the thumb is that on higher tiers the distribution becomes pretty much static again (pun intended) – 3%, 10%, 22%, 70%.
The logical recommendation and pattern usage is
– to use static resource groups when scaling up in order to get better concurrency.
– to use dynamic resource groups when scaling up the complex & resource intensive queries that do not need a lot of concurrency.
even though I keep remembering JRJ (James Rowland Jones) advertising for years the usage of the dynamic resource groups. :)
Important Note on the defaults
This is a very important concept where people stumble quite a lot –
By default, each user is a member of the dynamic resource class smallrc.
The resource class of the service administrator is fixed at smallrc and cannot be changed. Yeah – that is your user that you have created through the portal (or Powershell or ClI or whatever else you might be using)
This means that your default Portal/Azure SQL Server user while is all powerful on the permission level, has a very limited access to the processing resources of Azure Synapse Analytics it is managing. In the previous blog posts on Azure Synapse Analytics (such as
Columnstore Indexes – part 128 (“Ordering Columnstore Indexes in Azure SQL Datawarehouse”) , you can see that the default users on the smaller tiers are unable to achieve the necessary goals).
It makes a lot of sense – since managers are not doing the actual analytical work, they help it happen in the most effective way.
Note also that not every single operation is resource governed – the operations such as partition merging, statistics creation & update, SELECTs from system views and DMVs and DBCC (between many others, documented at https://docs.microsoft.com/pt-pt/azure/synapse-analytics/sql-data-warehouse/resource-classes-for-workload-management) are NOT RESOURCE GOVERNED.
Concurrency slots
Concurrency slots is another important concept that needs to be understood before diving into the Azure Synapse Analytics workload isolation, since this resource is even more finite than the memory (in my experience) and a lot of times one can be throttled by it way before hitting the limits of the physical resources. Each available Azure Synapse Analytics tier has a fixed number of Concurrency slots available (for example DW100c has just 4 available slots, DW500c has 20 slots and DW1500c has 600 slots) and every single resource class has a number of slots that it occupies on the respective Azure Synapse Analytics tier (for example smallrc resource class occupies 1 slot on DW100c, 1 slot DW500c and 18 slots on DW1500c, while staticrc10 will always have 1 slot reserved for all tiers).
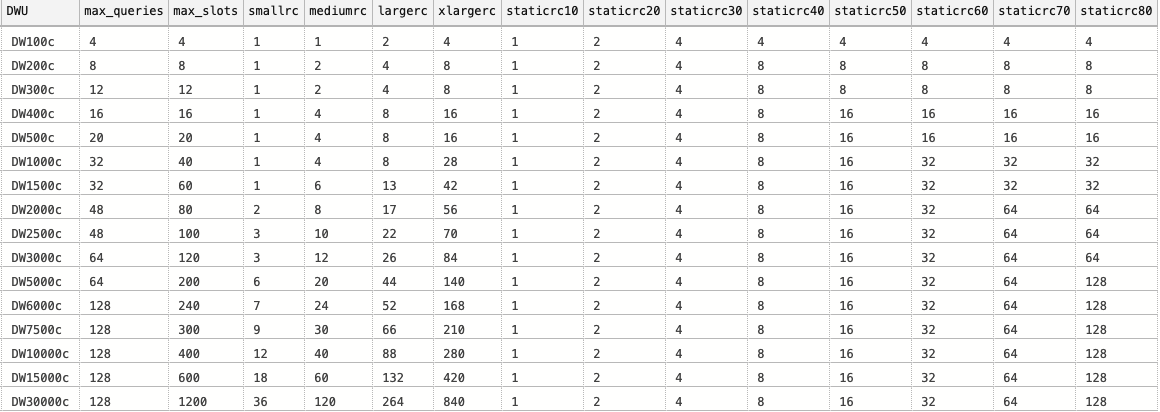 The detailed picture can be found on the image on the left of this text, where you can see that scaling does take place for the static resource classes starting with staticrc40, where it will occupy progressively more slots, and the better understanding can be easily drawn from the fact that you can run 600/132 = whooping 4 largerc queries on DW1500c, while on the DW500c you can just have 20/8 = just 2 largerc queries.
Concurrency Queries
The number of queries is limited for each of the Azure Synapse Analytics tiers and while you can run UP TO 4 queries on DW100c (as long as you did not spend all of the slots, and hence you can run either 4 smallrc queries or 2 largerc or just 1 xlargerc).
The absolute maximum number of queries that you can run in parallel on the biggest and the most expensive Azure Synapse Analytics instance is the 128 queries which are applicable starting with the DW600c tier, and using the mathematics you will easily arrive to the conclusion that in this case those must be mostly done with the mixture of the staticrc10 resource class, since it is the only tier that will allow to occupy just 1 slot out of the 240 total possible for that tier.
Workload Groups
Having caught up with some of the basic concepts, we are now ready to take a look at the workload groups and the way we can isolate different workloads.
A couple of months ago, Microsoft has introduced a new concept for the Resource Governance and workload isolation – the custom Workload Groups.
Those are the new custom types of Resource Classes where you can define & customize the usage of the resources & parallelism by your own needs.
For listing the currently configured workload groups, use the sys.workload_management_workload_groups DMV:
SELECT group_id, name, importance, min_percentage_resource, cap_percentage_resource, request_min_resource_grant_percent, request_max_resource_grant_percent, query_execution_timeout_sec, query_wait_timeout_sec
    FROM sys.workload_management_workload_groups
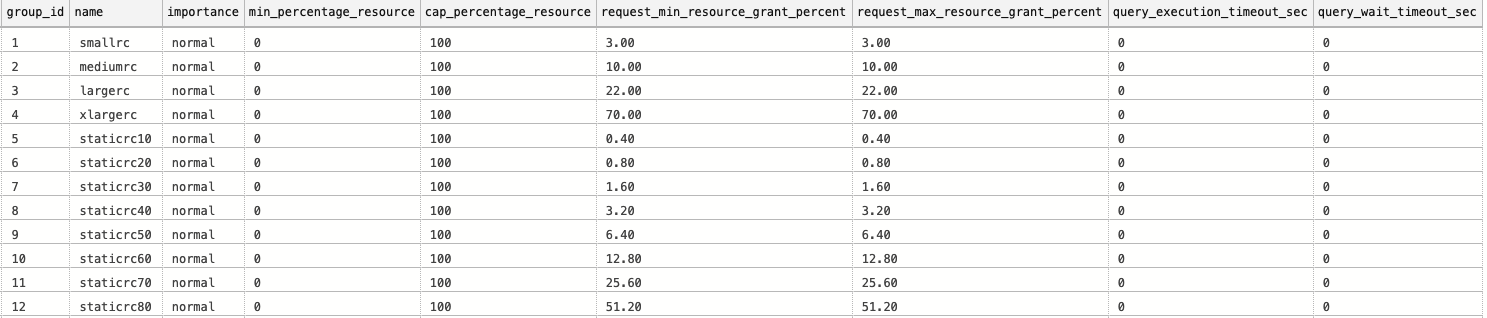 On the picture with the results you can see all the resource classes we have by default – the static and the dynamic ones.
The current syntax for creating workload groups is the following one (I expect it to be enhanced in time, as more customization becomes possible):
CREATE WORKLOAD GROUP group_name
[ WITH
 (  [ MIN_PERCENTAGE_RESOURCE = value ]
  [ [ , ] CAP_PERCENTAGE_RESOURCE = value ]
  [ [ , ] REQUEST_MIN_RESOURCE_GRANT_PERCENT = value ]
  [ [ , ] REQUEST_MAX_RESOURCE_GRANT_PERCENT = value ]
  [ [ , ] IMPORTANCE = { LOW | BELOW_NORMAL | NORMAL | ABOVE_NORMAL | HIGH } ]
  [ [ , ] QUERY_EXECUTION_TIMEOUT_SEC = value ] )
  [ ; ]
]
with values of :
MIN_PERCENTAGE_RESOURCE – defines the minimum GUARANTEED resource percentage that will be available for your own custom resource group and the value should be an integer between 0 and 100.
If you define more than 1 workload group, then the sum of the MIN_PERCENTAGE_RESOURCE values cannot be higher than 100.
This value should also respect the CAP_PERCENTAGE_RESOURCE and be lower then it.
(Important Note: the effective minimum and maximum values for the definition, depending on the chosen tier are applied)
CAP_PERCENTAGE_RESOURCE – defines the maximum resource usage for all request within your custom workload group. This value should be greater then MIN_PERCENTAGE_RESOURCE and can be any integer value between 1 and 100.
The actual effective value of CAP_PERCENTAGE_RESOURCE can be automatically lowered, if the REQUEST_MIN_RESOURCE_GRANT_PERCENT is configured to be higher then 0 in other workload groups.
REQUEST_MIN_RESOURCE_GRANT_PERCENT – defines the minimum amount of resources that shall be assigned to each request. The value is a variable between 0.75 to 100.00, which will depend on the maximum number of queries defined for your used tier and it should be a multiple of 0.25.
For example if you are using DW500c then your absolute maximum of parallel queries will be capped at 20, meaning that your absolute minimum value for your custom workload group will have to be set at 5%, and if you are using DW1500c then you could have up to 32 parallel queries, meaning that the maximum value for the REQUEST_MIN_RESOURCE_GRANT_PERCENT will be capped at 3%. The formula for calculation of the maximum is pretty easy – [MAX REQUEST_MIN_RESOURCE_GRANT_PERCENT] = 100.00 / [max_tier_parallelism];
You can definitely use lower values, if you wish, but always in multiples of 0.25 and you are not allowed to go below 0.75 value.
REQUEST_MAX_RESOURCE_GRANT_PERCENT – defines the maximum resource percentage per request IF THOSE RESOURCES ARE AVAILABLE AT THE REQUEST MOMENT. This value should naturally respect and be higher then REQUEST_MIN_RESOURCE_GRANT_PERCENT
IMPORTANCE – You can set the priority of the workload group between the others. The default value is naturally set to Normal.
We shall focus on the significance of the overriding this value within the group in the next blog post, that will be dedicated to the classifier.
QUERY_EXECUTION_TIMEOUT_SEC – defines the maximum number of seconds that query shall timeout if the execution is not finished. The default is 0 meaning that it will never time out. This count is activated once query starts running and not while it is in the queue, waiting to be picked up.
QUERY_WAIT_TIMEOUT_SEC – defines the maximum number of seconds that query shall timeout if the resources are not granted. The default is 0 meaning that it will never time out.
And so your Guaranteed Concurrency will be calculated by using the following formula:
[Guaranteed Concurrency] = [MIN_PERCENTAGE_RESOURCE] / [REQUEST_MIN_RESOURCE_GRANT_PERCENT]
Let’s make some examples and see how they work out and create a couple of workload groups that will help us isolating our Azure Synapse Analytics workloads:
1 Workload Group for the ETL processes
1 Workload Group for the Dashboard consumption
The code for the ETL processes on our DW500c tier, which we shall give 6 as a parallelism degree, allowing
CREATE WORKLOAD GROUP wgETL
WITH
  ( MIN_PERCENTAGE_RESOURCE = 60
    , CAP_PERCENTAGE_RESOURCE = 80
    , REQUEST_MIN_RESOURCE_GRANT_PERCENT = 10 -- Parallelism shall be defined as 6 = 60 / 10
  );
For the Dashboard Workload Group let us define Query Execution & Wait timeouts to 30 seconds and siginficantly lower minimum percentage resource (20%), hoping to allow our 10 users to consume the reports:
CREATE WORKLOAD GROUP wgDashboard
WITH ( MIN_PERCENTAGE_RESOURCE = 40
      ,CAP_PERCENTAGE_RESOURCE = 80
      ,REQUEST_MIN_RESOURCE_GRANT_PERCENT = 2 -- 20 parallel queries should be expected, because 40 / 2 = 20 :)
      ,QUERY_EXECUTION_TIMEOUT_SEC = 30
      ,QUERY_WAIT_TIMEOUT_SEC = 30 )
Running the check code against the sys.workload_management_workload_groups DMV gives us the following results
SELECT group_id, name, importance, min_percentage_resource, cap_percentage_resource, request_min_resource_grant_percent, request_max_resource_grant_percent, query_execution_timeout_sec, query_wait_timeout_sec
    FROM sys.workload_management_workload_groups
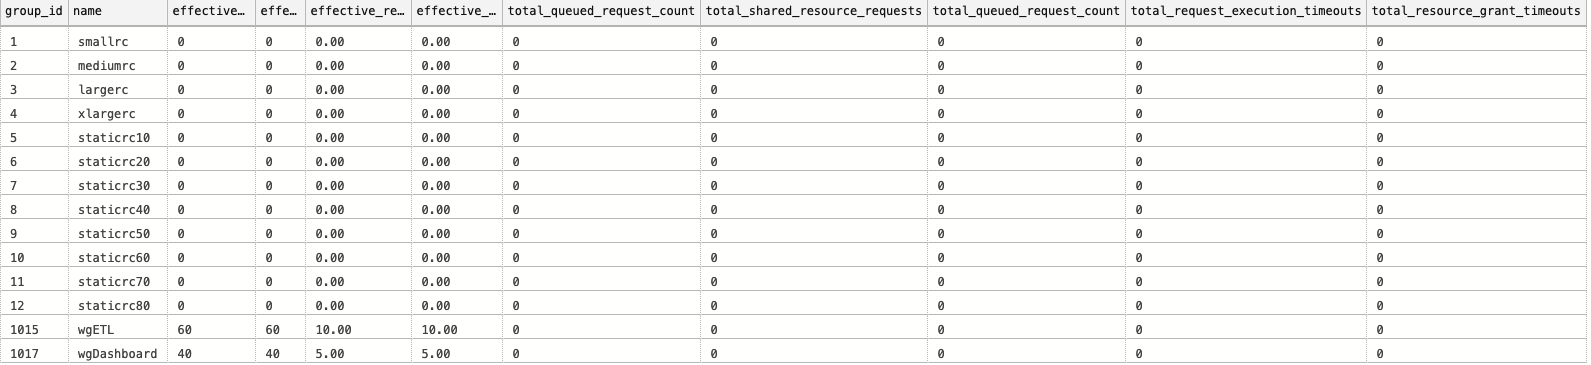
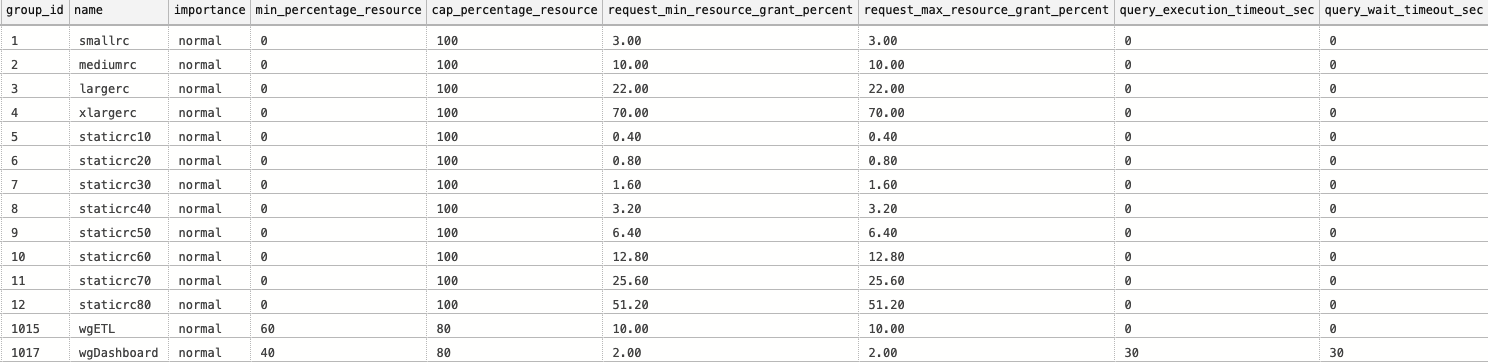 You can see on the top of this text an output of our query, this time with our 2 new custom workload groups and the values that we have defined. Naturally, we did not assigned any users to them, nor are the values are confirmed as the effective ones.
Why am I writing about the effective values ? Well, because if you were careful enough with reading descriptions – for every parameter set in the workload group definition
For the purpose of checking the effective values, let’s visit the sys.dm_workload_management_workload_groups_stats DMV:
SELECT wg.group_id, wg.name, effective_min_percentage_resource, effective_cap_percentage_resource, effective_request_min_resource_grant_percent, effective_request_max_resource_grant_percent,
    total_queued_request_count, total_shared_resource_requests, total_queued_request_count, total_request_execution_timeouts, total_resource_grant_timeouts
    FROM sys.dm_workload_management_workload_groups_stats st
    INNER JOIN sys.workload_management_workload_groups wg
        ON st.group_id = wg.group_id
    ORDER BY wg.group_id;
Surprise, Surprise!
The effective_request_min_resource_grant_percent & effective_request_max_resource_grant_percent are showing that we shall be using 5% for each of the values that were defined as 2%, thus effectively lowering the maximum number of parallel queries from expected 20 to … (drumroll) 8 … which won’t be that much acceptable.
We might need to scale up in order to get the needed parallelism or we might have to reconfigure our workload group.
Dear Microsoft, I wish there would be an easier way of determining this, instead of what I had to pass through.
After Scaling
Another good question is what happens after scaling with the effective values ?
Well, they will be recalculated and adjusted according to the tier …
Let’s scale down our Azure Synapse Analytics database to DW100c and see what shall happen:
--Run-time values
SELECT wg.group_id, wg.name, effective_min_percentage_resource, effective_cap_percentage_resource, effective_request_min_resource_grant_percent, effective_request_max_resource_grant_percent,
    total_queued_request_count, total_shared_resource_requests, total_queued_request_count, total_request_execution_timeouts, total_resource_grant_timeouts
    FROM sys.dm_workload_management_workload_groups_stats st
    INNER JOIN sys.workload_management_workload_groups wg
        ON st.group_id = wg.group_id
    ORDER BY wg.group_id
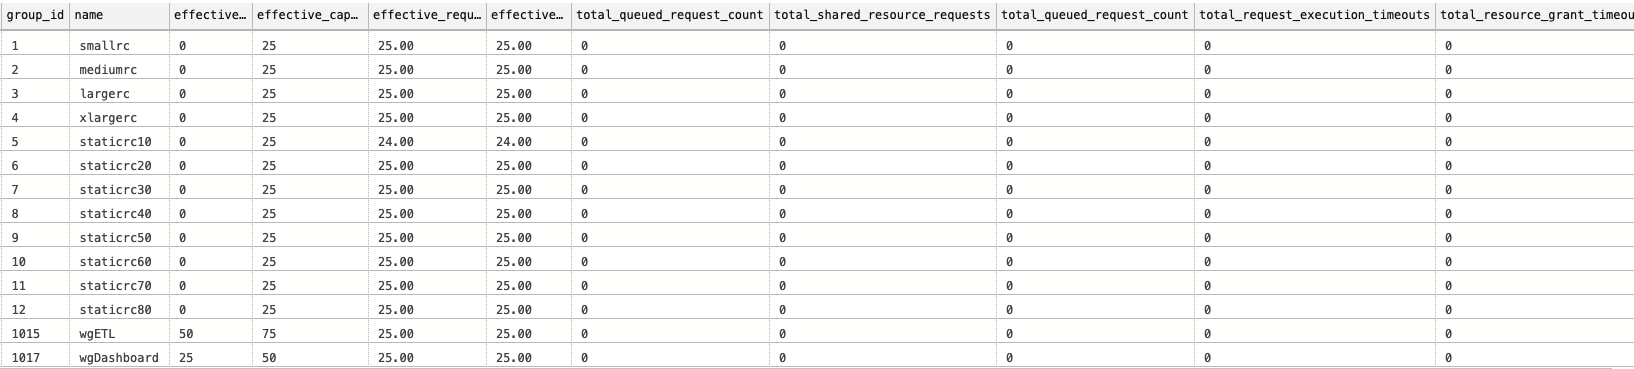
This time we have 25% for both ETL and Dashboard workload groups, because at the DW100c this is where you will end most of the time, you will see yourself simply following our good old friends – dynamic resource classes.
Bad, bad Alter
Should you decide that you want to change/alter your workload group – it seems that currently this possibility is not provided, since running the following code
 ALTER WORKLOAD GROUP wgDashboard
    WITH (QUERY_WAIT_TIMEOUT_SEC = 0);
gives the following error:
Msg 103010, Level 16, State 1, Line 1
Parse error at line: 1, column: 8: Incorrect syntax near 'WORKLOAD'.
which points that the command ALTER WORKLOAD GROUP is not supported at all :(
Assign Workload Group
To assign the workload group we shall need to create a workload classifier, such as the below following code (Note that we shall dive into classifiers in the next blog post of the series):
CREATE WORKLOAD CLASSIFIER [wgcETLDeveloper]
WITH (WORKLOAD_GROUP = 'wgETL'
      ,MEMBERNAME = 'ETLDeveloper');


CREATE WORKLOAD CLASSIFIER [wgcCTO]
WITH (WORKLOAD_GROUP = 'wgDashboard'
      ,MEMBERNAME = 'CTO');

CREATE WORKLOAD CLASSIFIER [wgcCFO]
WITH (WORKLOAD_GROUP = 'wgDashboard'
      ,MEMBERNAME = 'CFO');

CREATE WORKLOAD CLASSIFIER [wgCEO]
WITH (WORKLOAD_GROUP = 'wgDashboard'
      ,MEMBERNAME = 'CEO');
and voilá – those users will be assigned to the respective groups! :)
Final Thoughts
I love the feature and happy to see the necessary requirement for any Enterprise deployment – the Resource Governor.
I dislike the complexity and the implications of the effective values and the scaling operations, but at least the part of the scaling is understandable.
I would prefer more explicit information about the effective values.
The impossibility to alter the Workload Group is disappointing (Yeah, I know this is still a preview, but since November 2019 we have advanced 6 months).
The necessary calculations for the REQUEST_MIN_RESOURCE_GRANT_PERCENT and resulting available parallelism are a nightmare and a regular developer might simply raise their hands and say – I do not want to do this at all.
Yeah, it will increase the need of people like me, who can dive into it, but I doubt that this is the idea behind this feature. :)
to be continued …
Hi Niko, Tremendeous work with the explanation and deducing how workload management works in Synapse. What I understood is this is beneficial for the environments where you have quite a few concurrent users.
I am trying to understand this in terms of the performance impact on a single query. Does it mean that if we associate a user group with say xlarge resource group, the query could give us results faster because the user group now can access 70 percent of the available synapse resources?
Hi Lokesh,
yes it MIGHT give you results faster (if your queries are suffering from lack of memory such as in the case of spills), but in turn you will have smaller number of parallel queries of course.
I suggest you to carefully test your assumptions and not to forget as your data will grow and you will scale up your Synapes, you might be finding yourself overspending the resources.
Best regards,
Niko Neugebauer
Hi Niko, tremendous work in putting this all together.
Based on my understanding, is it fair to say that if a synapse account is set up at 1000 DWU, using largerc and xlargerc would be a better choice for executing queries as they will be utilizing more of the warehouse resources?
Hi Lokesh,
that would depend on the requirements.
IF you are running just a single ETL process which is not parallelized – then the answer is yes, for example.
Best regards,
Niko Neugebauer
Hi Niko. Great article. Thanks a lot.
ALTER command is available and documented here https://docs.microsoft.com/en-us/sql/t-sql/statements/alter-workload-group-transact-sql?view=azure-sqldw-latest. Probably some update would be good.
Hi Dmitry,
thank you – article updated.
Best regards,
Niko