Continuation from the previous 108 parts, the whole series can be found at https://www.nikoport.com/columnstore/.
Do you remember one of the major problems in SQL Server 2014 using Columnstore Indexes ? It was the lack of the support for the Batch Execution Mode with just a single core. We would get wonderful, fast execution plans with MAXDOP >= 2, which will go terribly slow if there would not be enough memory to run the query with 2 or more cores, or if the internal query cost would be below the parallel execution threshold (cost threshold for parallelism)
OR if the execution plan would be dimmed as TRIVIAL by the Query Optimiser, thus getting a single core execution and running really slow.
Once we upgraded to SQL Server 2016, the problem of inability of the single core Batch Mode execution would fade away, but still, sometimes some queries would run terribly slow for some reason …
One of the reasons behind this are the trivial execution plans, which are running Columnstore Index Scan in the Row Execution Mode – also known as a VerySlowExecutionMode for the big amounts of data.
This post is about a major change to the Batch Execution Mode affecting Columnstore Indexes because in SQL Server 2017 there is an internal optimisation for the Query Optimiser, that shall apply FULL optimisation to the execution plans with the Columnstore Indexes, avoiding the pitfall of executing them in the Row Execution Mode, but let’s start a little bit from the beginning with examples of the problem.
For that, I will once again use the free test database ContosoRetailDW on 2 different Virtual Machines with SQL Server 2016 & SQL Server 2017 RC1 respectively, setting the compatibility level to 130 on SQL Server 2016 and to 140 on SQL Server 2017 RC1.
/*
 * Queries for testing Columnstore Indexes
 * by Niko Neugebauer (https://www.nikoport.com)
 * These queries are to be run on a Contoso BI Database (http://www.microsoft.com/en-us/download/details.aspx?displaylang=en&id=18279)
 *
 * Restores ContosoRetailDW database from the source, which should be placed in C:\Install\
 *
 */
USE [master]

alter database ContosoRetailDW
    set SINGLE_USER WITH ROLLBACK IMMEDIATE;

RESTORE DATABASE [ContosoRetailDW]
    FROM  DISK = N'C:\Install\ContosoRetailDW.bak' WITH  FILE = 1,
        MOVE N'ContosoRetailDW2.0' TO N'C:\Data\SQL16\ContosoRetailDW.mdf',
        MOVE N'ContosoRetailDW2.0_log' TO N'C:\Data\SQL16\ContosoRetailDW.ldf',
        NOUNLOAD,  STATS = 1;

alter database ContosoRetailDW
    set MULTI_USER;
GO

GO
ALTER DATABASE [ContosoRetailDW] SET COMPATIBILITY_LEVEL = 140 /* Set the compatibility level to 130 for SQL Server 2016 */
GO

use ContosoRetailDW;

ALTER TABLE dbo.[FactOnlineSales] DROP CONSTRAINT [PK_FactOnlineSales_SalesKey];

create clustered columnstore Index PK_FactOnlineSales
	on dbo.FactOnlineSales;
We shall need to do an important setup here, to set the value for the ‘cost threshold for parallelism’ to some reasonable value, such as 50. /* Please do not set it automatically to this or any other value in Production without thinking well about the consequences, and without testing on your pre-production environment */:
EXEC sys.sp_configure N'cost threshold for parallelism', N'50'
GO
RECONFIGURE WITH OVERRIDE
GO
Lets run a rather simple query against both SQL Server 2016 and SQL Server 2017:
DBCC FREEPROCCACHE
DBCC DROPCLEANBUFFERS

SELECT COUNT_BIG(*)
	FROM dbo.FactOnlineSales
There is nothing special in it, I would say, it the query is rather trivial :)
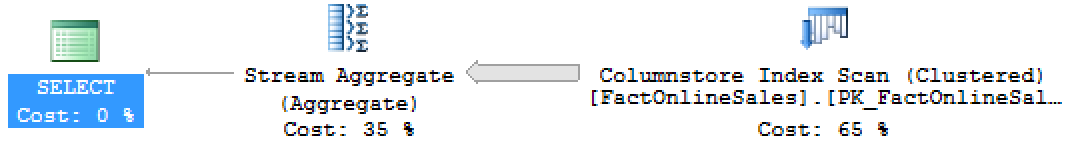
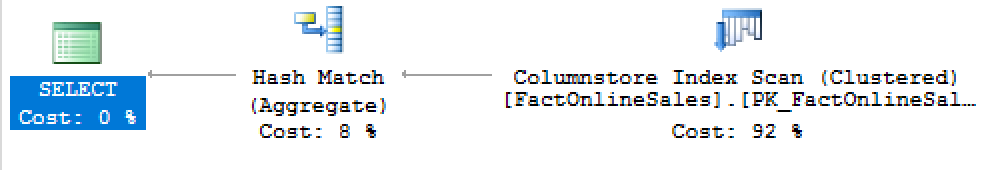
Here are the execution plans for both of the SQL Servers (2016 vs 2017 RC1) and I guess that you will not need any additional details about the execution time, because just looking at the execution plans will be enough to determine that once we see the Stream Aggregate operation for the Columnstore Indexes – it means that something went wrong and that most probably the Row Execution Mode is here the uninvited guest:
 What happens exactly with the SQL Server 2016 that it has decided to use the slow execution plan?
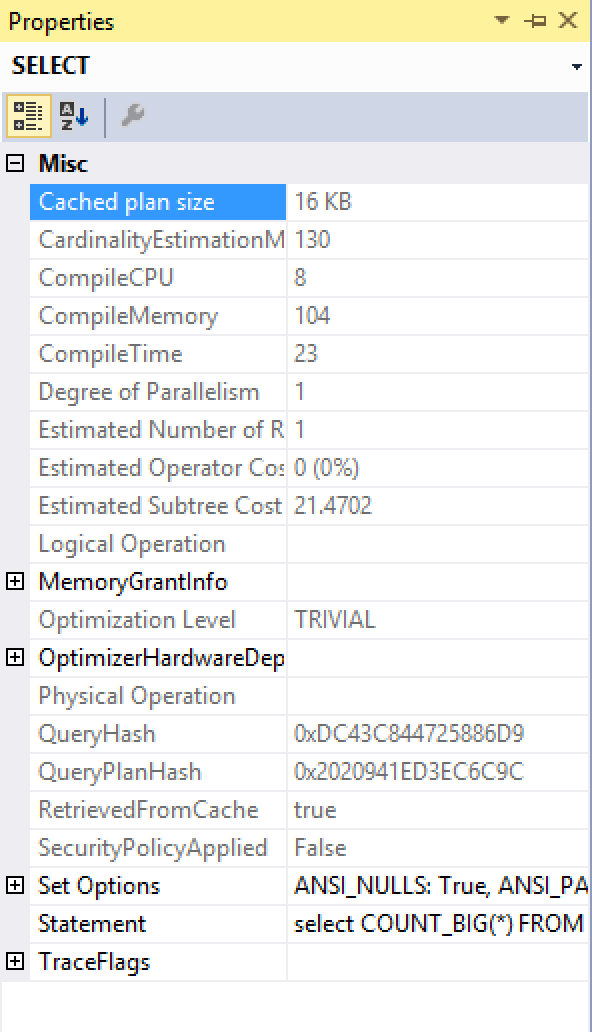
Let’s see the properties of the execution plan, where we can easily discover that in SQL Server 2016 we have a TRIVIAL execution plan, while in SQL Server 2017 RC1 the plan takes advantage of the FULL optimisation, thus getting the Batch Execution Mode and the faster execution speed consecutively.
The query itself is simply way too simple for the optimiser to spend time and optimise it, by default in SQL Server 2016. Of course for those using SQL Server 2016, there are some solutions to the problem:
– if you query cost is below ‘cost threshold for parallelism’, then adding non-changing-result conditions that will force your estimated query cost above the threshold is one of the priorities
– altering the query by adding obvious and non-changing-result conditions that will force optimiser into more work (1 <> 0, PostiviceColumn > 0, etc) and into Full cost-based optimisations eventually.
– using undocumented & unsupported Trace Flag 8757 that will skip the TRIVIAL optimisation and goes to full optimisation of our query.
Here are a couple of examples of what I am using to improve the situation with the TRIVIAL execution plans and the columnstore indexes on SQL Server 2016:
SELECT COUNT_BIG(*)
	FROM dbo.FactOnlineSales
	WHERE EXISTS (SELECT * WHERE 2 > 1 );

SELECT COUNT_BIG(*)
	FROM dbo.FactOnlineSales
        OPTION (QueryTraceOn 8757);
Notice that this change is connected to the Compatibility Level of the SQL Server 2017, which is 140, and setting the compatibility level to any other lower number will result in the previous functionality, which will execute the simple queries with a Trivial optimisation level – making Columnstore Indexes to run in the Row Execution Mode.
Here is the script to prove it:
ALTER DATABASE [ContosoRetailDW] SET COMPATIBILITY_LEVEL = 130;

SELECT COUNT_BIG(*)
	FROM dbo.FactOnlineSales;

Like with SQL Server 2016, some of the juiciest improvements in the query optimisation are connected to the compatibility level of SQL Server 2017.
Extended Event compilation_stage_statistics
There is a new Extended Event in the SQL Server 2017, which is called compilation_stage_statistics and that contains some interesting information related to the TRIVIAL execution plan optimisation. Note: you will find it in the Debug channel, and so it won’t be searchable by default through the GUI, you will need to select this channel first.
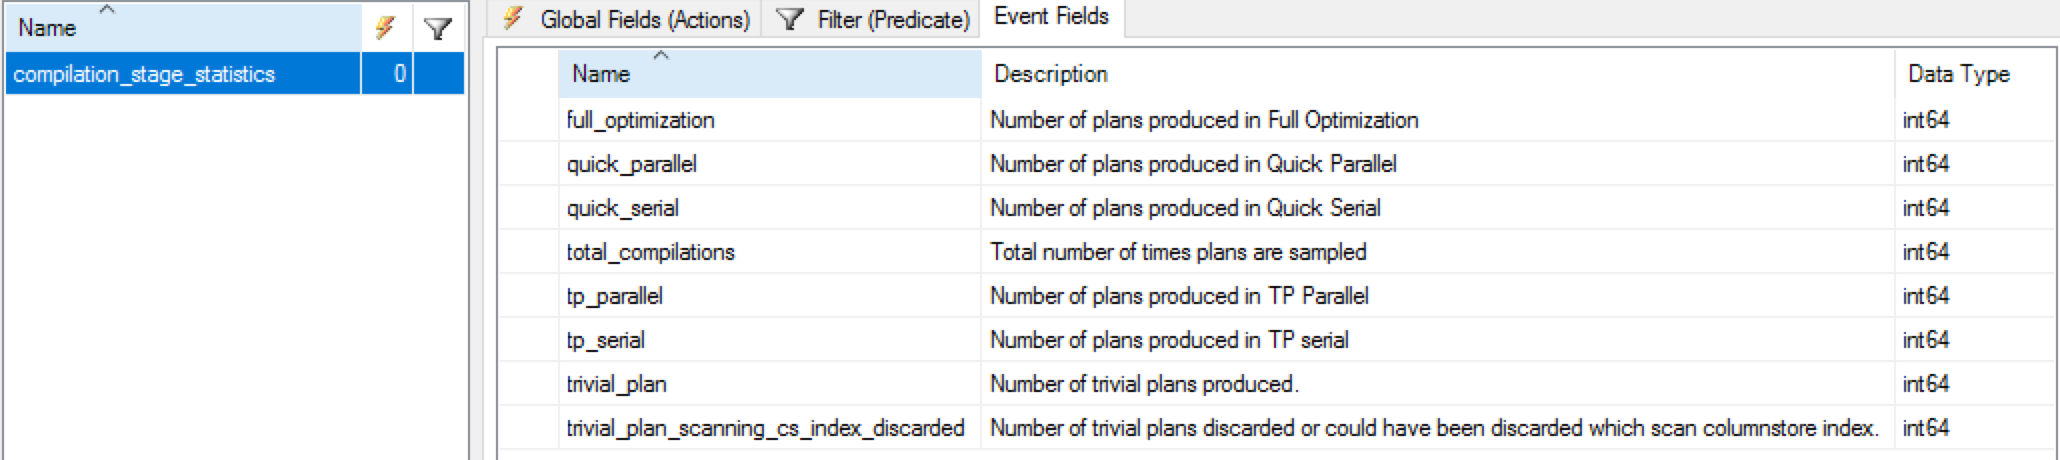
This event looks like a gold mine for those who are interested in diving into the Query Optimiser decisions … :) The most exciting property for the purpose of this blog post is “trivial_plan_scanning_cs_inde_discarded” that is described as “Number of trivial plans discarded or could have been discarded which scans columnstore index”.
Unfortunately in the short time I have tested this Extended Event I was not able to get any results out of this XE in the RC1, but I will update this blog post as soon as I will manage to do so
Final Thoughts
Very cool optimisation under the hood of the SQL Server which will go largely unnoticed by the most people, but which will do some very positive magic for those of us who care about the speed.
to be continued with Columnstore Indexes – part 110 (“The best column for sorting Columnstore Index on”)
Excellent!
I’ve noticed a number of optimizer timeouts with CCI queries – occurring as early as 10 ms and even under 1 mb of optimizer memory. I’ll compare some of these queries in SQL Server 2016 & 2017… pulling through to full optimization for CCI queries *might* be enough to get them to further stages without timing out?
I’m using queries involving tables with cluster columnstore indices and regular tables in SQL server 2016 ( version 13.0.4001.0). some queries take very long, 20 30 minutes, just to provide the estimate execution plan. And even so the same time or more to execute the query, which then it runs fast. Not sure of this behavior. Are there any workarounds?
Hi Jesus,
Some questions I would like to ask:
– is there some locking going on ? Do you have the details on it ?
– are you using any trace flags ?
– what are the query wait stats ?
– what is the number of partitions in the table ?
– what is the number of the Row Groups and the average number of rows per Row Group ?
High Compilation times are not uncommon, but a lot of times there is an explanation for it.
Best regards,
Niko