Continuation from the previous 92 parts, the whole series can be found at https://www.nikoport.com/columnstore/.
Given that currently the Batch Execution Mode is an exclusive feature of the Columnstore Indexes, and that the new developments in the query optimisation area are mainly targeting In-Memory & Columnstore Features, in SQL Server vNext (post 2016) we shall have some incredible automatic Query Processing optimisations that will be working for the first phase exclusively for the Batch Execution Mode.
The project name of this improvement for the SQL Server vNext & Azure SQL Database is called “Adaptive Query Execution”.
The first 3 announced feature of the Adaptive Query Execution are
Interleaved Execution, Batch Mode Execution Adaptive Join & Batch Mode Adaptive Query Memory Feedback. In this blog post I will focus on the available and accessible information on the last one – the atch Mode Adaptive Query Memory Feedback, and the other 2 features will be taken to the test as soon as they become available.
As already described by Joe Sack in Introducing Batch Mode Adaptive Memory Grant Feedback, the idea behind this feature is to improve the memory grants for the 2nd and consecutive executions of the same query queries by adjusting the sizes (the total and the memory fractions of the individual iterators as well).
This adjustment might take place based of the inedequacy of the estimated number of rows (which is based on the statistics available at the time of the execution time generation) related to the real execution number of rows that the iterator/query is processing.
The 2 possible adjustment scenarios are:
– when estimated number of rows is too high and the memory is granted to the query, even though the query itself will not use it.
– when estimated number of rows is too low and the memory operations such as hashing or sorting will not have enough space to fit the complete data sets, thus making them spill on to the TempDB (temporary storing the data while doing the work, based on the lacking of the available memory to the query).
Correcting the cardinality estimates that were compiled at the time of the execution plan generation is the ultimate goal of the Batch Mode Adaptive Memory Grant Feedback.
The idea is not to change the generated execution plan or to create a new one, but to adjust the size of the memory grants – making query running faster and more efficient, in the way that for the 1st scenario the actual memory grant will be lowered making more queries to execute at the same time (a good question here is if a query can pass through a lower gateway if the memory grant will be lowered that much),
while for the 2nd scenario the overall performance of the query shall be improved because with more memory to work with, the query will be spilling (writing and reading) to TempDB less – thus finishing faster.
The Batch Mode Adaptive Memory Grant Feedback will be triggered only if the granted memory is more than 2 times bigger than the actually used memory for the queries with memory grants bigger than 1 MB. Should there be not enough memory, than an Extended Event spilling_report_to_memory_grant_feedback will provide a starting point for the Query Optimiser.
This sounds like a very exciting feature, but how does it look ? How does it work in practice and how can we determine if our query was adapted (adjusted) or not ?
For the tests, I will use 2 different Virtual Machines – with SQL Server 2016 Service Pack 1 and the currently available SQL Server vNext CTP Version 1.1.
As in the most blog posts before, ContosoRetailDW free sample database from Microsoft will be serving as the base for the examples.
In the script below, I am restoring a copy of this database from the backup, that is located in C:\Install folder, updating it’s compatibility level to 140 (vNext) or 130 (SQL 2016 SP1 – you will need to update this script yourself) and remove the Primary Clustered Index on the FactOnlineSales table before creating a Clustered Columnstore Index on it:
USE [master]

alter database ContosoRetailDW
    set SINGLE_USER WITH ROLLBACK IMMEDIATE;

RESTORE DATABASE [ContosoRetailDW]
    FROM  DISK = N'C:\Install\ContosoRetailDW.bak' WITH  FILE = 1,
        MOVE N'ContosoRetailDW2.0' TO N'C:\Data\ContosoRetailDW.mdf',
        MOVE N'ContosoRetailDW2.0_log' TO N'C:\Data\ContosoRetailDW.ldf',
        NOUNLOAD,  STATS = 5;

alter database ContosoRetailDW
    set MULTI_USER;
GO

GO
ALTER DATABASE [ContosoRetailDW] SET COMPATIBILITY_LEVEL = 140
GO
ALTER DATABASE [ContosoRetailDW] MODIFY FILE ( NAME = N'ContosoRetailDW2.0', SIZE = 2000000KB , FILEGROWTH = 128000KB )
GO
ALTER DATABASE [ContosoRetailDW] MODIFY FILE ( NAME = N'ContosoRetailDW2.0_log', SIZE = 400000KB , FILEGROWTH = 256000KB )
GO

use ContosoRetailDW;

-- Drop the Primary Key and the Clustered Index with it
ALTER TABLE dbo.[FactOnlineSales] DROP CONSTRAINT [PK_FactOnlineSales_SalesKey];

-- Created the Clustered Columnstore Index
create clustered columnstore Index PK_FactOnlineSales
	on dbo.FactOnlineSales;
I have taken a slightly modified version of one of my traditional test queries that I am using in my workshops and ran it against our star-schema database:
select prod.ProductName, sum(sales.SalesAmount)
	from dbo.FactOnlineSalesMem sales
		inner join dbo.DimProduct prod
			on sales.ProductKey = prod.ProductKey
		inner join dbo.DimCurrency cur
			on sales.CurrencyKey = cur.CurrencyKey
		inner join dbo.DimPromotion prom
			on sales.PromotionKey = prom.PromotionKey
	where cur.CurrencyName = 'USD' and prom.EndDate >= '2004-01-01'
	group by prod.ProductName;
Below you will find the execution plan for the query, which looks exactly the same for the SQL Server 2016 Service Pack 1 and for the SQL Server vNext:
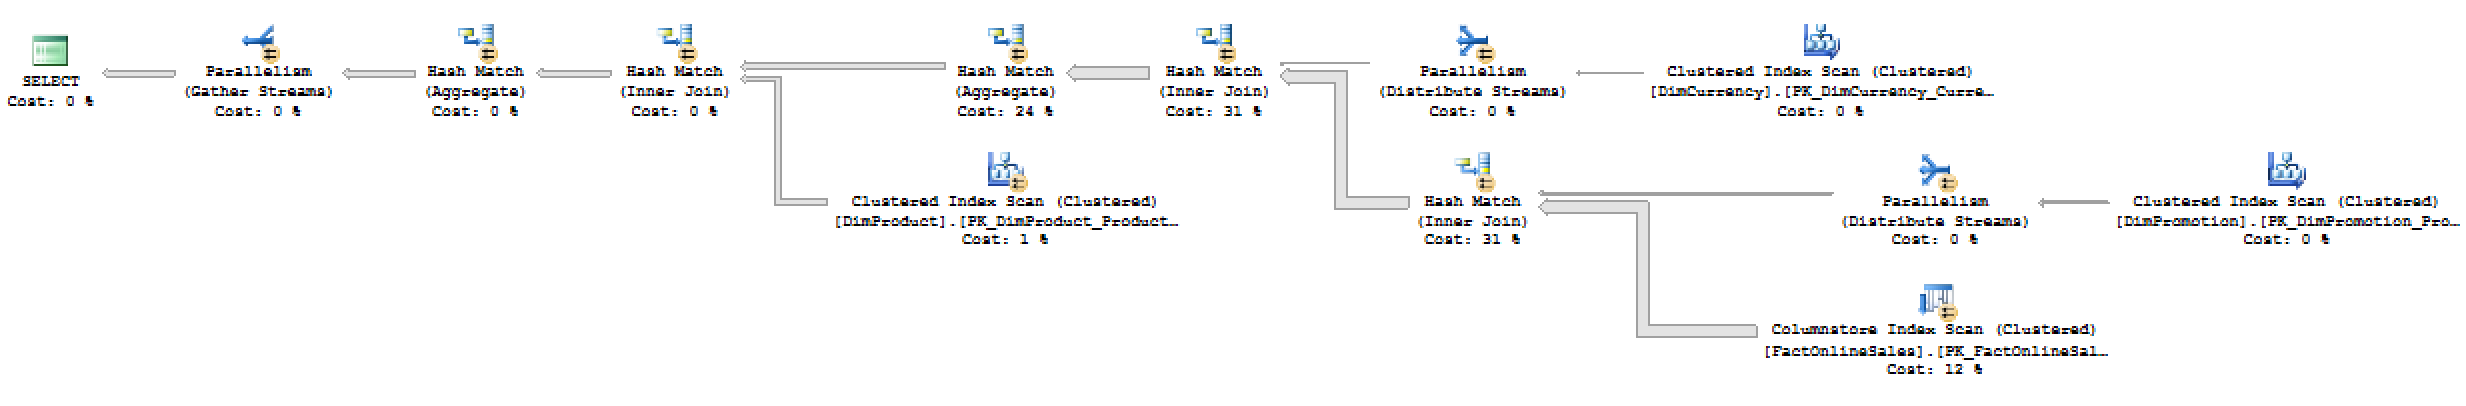
 The original memory grant for the both SQL Server versions is 40196 KB plus the memory fractions for the individual iterators are equal, showing that for the first time execution query right now the SQL Server vNext has no significant changes for the query estimation for this specific scenario.
But what about the consequent executions of the same query ? The promise of the Batch Mode Adaptive Memory Grant Feedback is that not the first, but the second and further executions of the query might show some changes for the total memory grant and for some iterator memory fractions.
Let’s execute the same query for the second time and even better let’s execute the following script, which will reset the clean memory buffers, recompile the original query (option (recompile)) and execute the same query again but without recompilation in the original form.
DBCC FREEPROCCACHE

select prod.ProductName, sum(sales.SalesAmount)
	from dbo.FactOnlineSales sales
		inner join dbo.DimProduct prod
			on sales.ProductKey = prod.ProductKey
		inner join dbo.DimCurrency cur
			on sales.CurrencyKey = cur.CurrencyKey
		inner join dbo.DimPromotion prom
			on sales.PromotionKey = prom.PromotionKey
	where cur.CurrencyName = 'USD' and prom.EndDate >= '2004-01-01'
	group by prod.ProductName
OPTION ( RECOMPILE );

select prod.ProductName, sum(sales.SalesAmount)
	from dbo.FactOnlineSales sales
		inner join dbo.DimProduct prod
			on sales.ProductKey = prod.ProductKey
		inner join dbo.DimCurrency cur
			on sales.CurrencyKey = cur.CurrencyKey
		inner join dbo.DimPromotion prom
			on sales.PromotionKey = prom.PromotionKey
	where cur.CurrencyName = 'USD' and prom.EndDate >= '2004-01-01'
	group by prod.ProductName;
The execution plan generated for the second query is naturally the same as for the first one, but there is something different about it, which is not instantly detectable while viewing the plan itself. We need to take a look at the memory grant for our query:
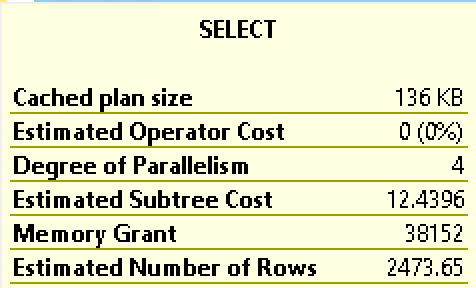
38 152 KB !!! That is not the original amount of memory we have received for the first execution of the query, where the value was 40196 KB. Without modifications of the execution plan iterators, this is the single most significant change for the execution plan which is working as advertised – it has adjusted the amount of memory available for the query, by lowering the number because the original given memory was too high.
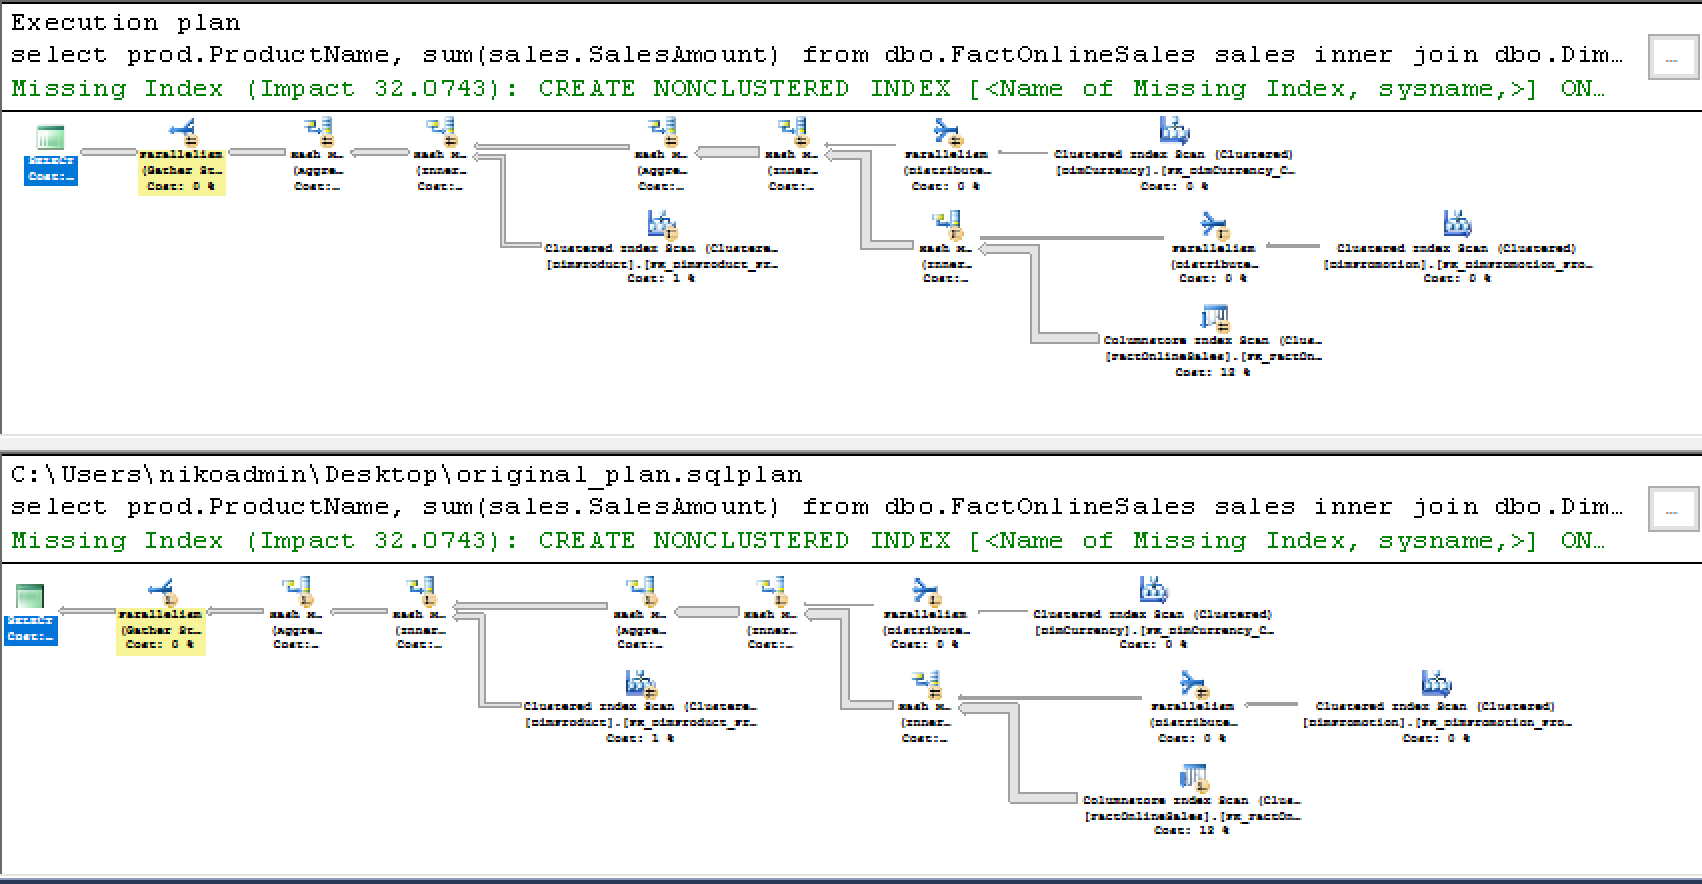
I have used the internal SSMS tool “Plan Comparison” in order to find out in an easy way the differences and below on the image you can see with the highlighting put only on the differences that the execution plans are virtually the same:
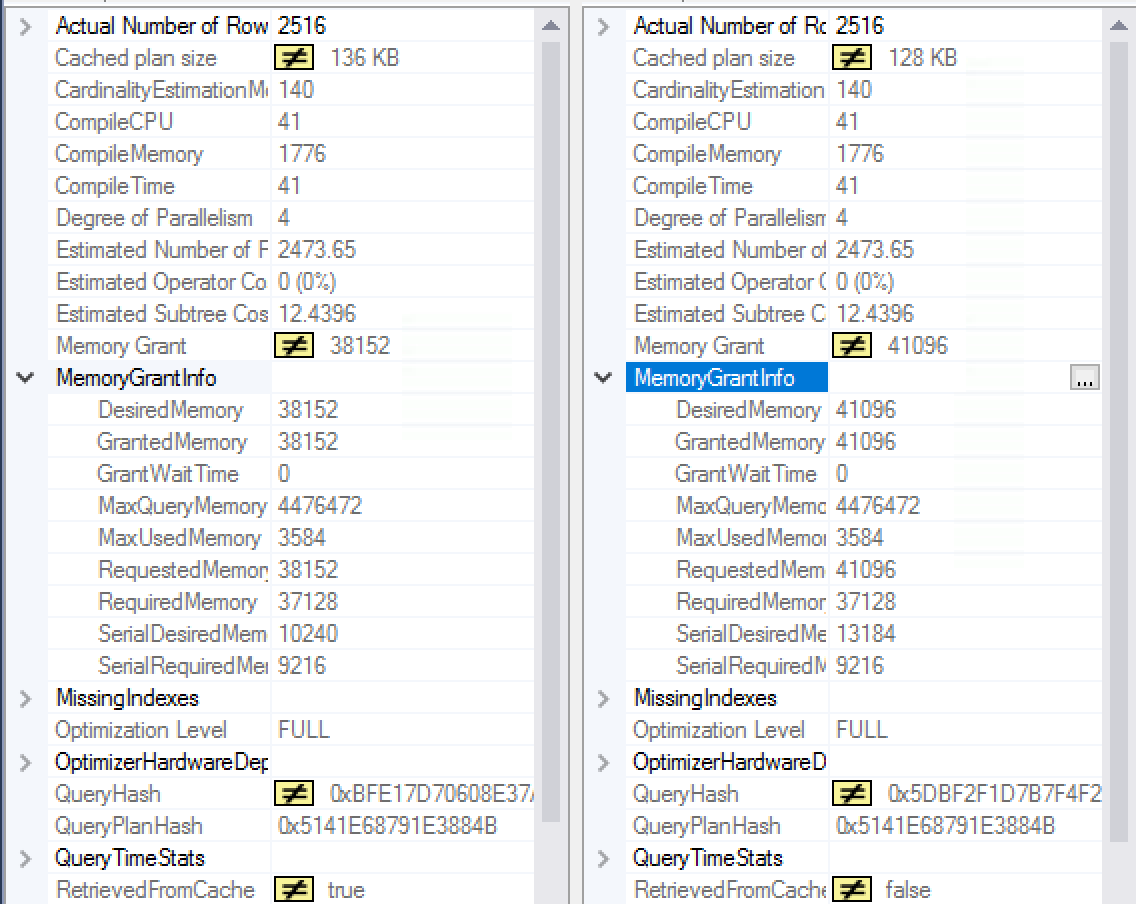 The information on the query grants shows the differences for the memory grants with the information on the left pane showing the 38 152 KB memory grant for the second & further executions of the plan while the original first execution is shown on the right side with the Requested Memory being set to 41 096 KB. The other important details include “RetrievedFromCache” option where the left plan (2nd and posterior executions) is definitely using cached plan, while the original query naturally is generating the execution plan for the first time and hence has nothing to retrieve from the cache. To be absolutely and positively sure that we dealing with the very same execution plan, please notice that the Query Hash as well as the Query Plan Hash are absolutely the same meaning that we are dealing in fact with the same query and the same execution plan, which has been adapted/adjusted according to the memory necessities.
Let us make sure that we understand everything correctly – let’s use the Query Plan Hash for the following query, which will extract the information from the DMV sys.dm_exec_query_stats, especially the newest columns since SQL Server 2016, such as min_grant_kb, min_grant_kb, max_grant_kb, last_grant_kb, min_ideal_grant_kb, max_ideal_grant_kb, last_ideal_grant_kb, max_used_grant_kb:
SELECT top 1 ST.text AS "Query Text"
	, QS.query_hash AS "Query Hash"
    , QS.query_plan_hash AS "Query Plan Hash"
	, execution_count as Execs
	, min_grant_kb
	, max_grant_kb
	, last_grant_kb
	, min_ideal_grant_kb
	, max_ideal_grant_kb
	, last_ideal_grant_kb
	, max_used_grant_kb
FROM sys.dm_exec_query_stats QS
    CROSS APPLY sys.dm_exec_sql_text (QS.sql_handle) ST
where query_plan_hash = 0x5141E68791E3884B
order by creation_time desc;
![]()
From the information provided on the picture above you can see that we have executed the query twice with minimum and maximum memory grants equals to the information we have previously seen in our execution plans. More importantly we can see that the value used in the last execution plan corresponds to the Minimum Ideal Memory Grant in KB that is provided – 38152 KB. This happens because the the currently Max Used Grant in KB was equals to 3584 KB, the value way below the estimates, meaning that the Query Optimiser did a great job in lowering the original 41 MB to 38 MB for our 2nd execution of the query.
Option Optimise for Ad-Hoc Workloads
We all know and love the SQL Server Configuration option “Optimize for ad hoc workloads“, and in the most if not all Data Warehouses it is enabled by default … Will it’s enabling affect the execution plan generation and consecutive Batch Mode Adaptive Memory Grant Feedbacks in some kind of way ?
Let’s enable it on the SQL Server vNext Virtual Machine in Azure:
EXEC sys.sp_configure N'show advanced options', N'1'
RECONFIGURE
EXEC sys.sp_configure N'optimize for ad hoc workloads', N'1'
And run the same query while monitoring the result:
-- Run the free proc cache only once !!!!!!!!!!!
DBCC FREEPROCCACHE

select prod.ProductName, sum(sales.SalesAmount)
	from dbo.FactOnlineSales sales
		inner join dbo.DimProduct prod
			on sales.ProductKey = prod.ProductKey
		inner join dbo.DimCurrency cur
			on sales.CurrencyKey = cur.CurrencyKey
		inner join dbo.DimPromotion prom
			on sales.PromotionKey = prom.PromotionKey
	where cur.CurrencyName = 'USD' and prom.EndDate >= '2004-01-01'
	group by prod.ProductName;
To spare the time with the trivial details I can share that the only thing that changes is that the execution plan is not generated on the first execution, but a simple stub is stored for the plan, meaning that only the 3rd and consecutive executions will start seeing the effect of the Batch Mode Adaptive Memory Grant Feedback, because the execution plan will be stored in the cache only on the 2nd execution, but otherwise everything will work as without the Optimise for Ad-Hoc Workloads option.
Monitoring with Extended Events
As Joe Sack has specified in his announcement post, the current way of monitoring the Batch Mode Adaptive Memory Grant Feedback is by using memory_grant_updated_by_feedback extended event and for that purpose here is the T-SQL code for configuration of an Extended Events session targeting Ring Buffer:
CREATE EVENT SESSION [memory_grant_updated_by_feedback] ON SERVER
ADD EVENT sqlserver.memory_grant_updated_by_feedback(
    ACTION(sqlserver.plan_handle,sqlserver.sql_text,sqlserver.username))
ADD TARGET package0.ring_buffer
WITH (EVENT_RETENTION_MODE=NO_EVENT_LOSS)
GO
Let’s run our test script while monitoring the output of the Extended Session that we have just configured:
DBCC FREEPROCCACHE

select prod.ProductName, sum(sales.SalesAmount)
	from dbo.FactOnlineSales sales
		inner join dbo.DimProduct prod
			on sales.ProductKey = prod.ProductKey
		inner join dbo.DimCurrency cur
			on sales.CurrencyKey = cur.CurrencyKey
		inner join dbo.DimPromotion prom
			on sales.PromotionKey = prom.PromotionKey
	where cur.CurrencyName = 'USD' and prom.EndDate >= '2004-01-01'
	group by prod.ProductName;
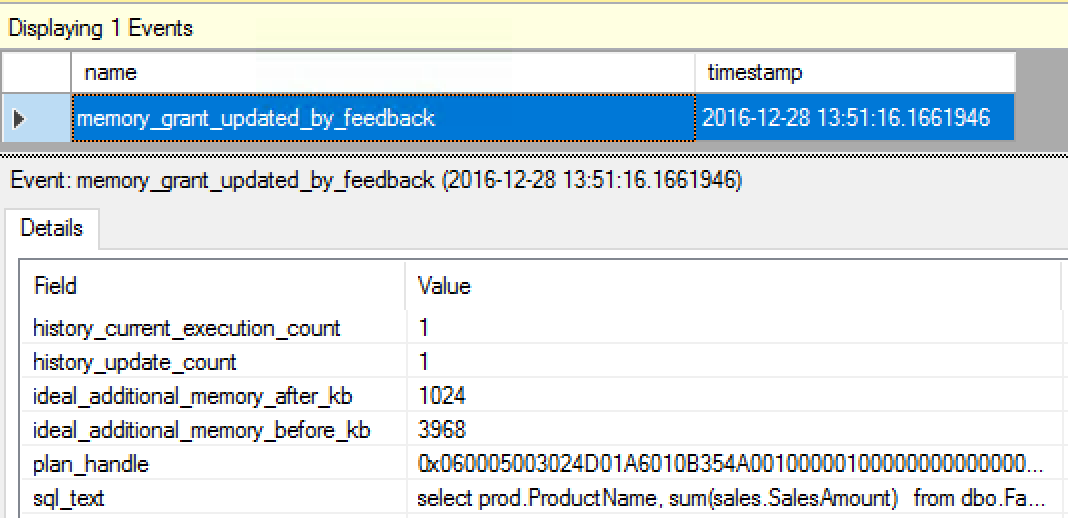
The information provided by the Extended Events Session will show us the occasions when Memory Grant was adjusted/updated, with the default information on the number of current plan executions and the number of updates to the original plan, plus the information on the additional memory grant before & after update.
TempDB Spilling Correction
So far we have considered only 1 scenario where the excessive memory grants are corrected – but what about the scenario number 2 where we did not have enough memory for our initial execution plan ?
Let’s set up an Extended Events Session for checking on the sqlserver.spilling_report_to_memory_grant_feedback Extended Event:
CREATE EVENT SESSION [Batch Spills Correction] ON SERVER
ADD EVENT sqlserver.spilling_report_to_memory_grant_feedback(
    ACTION(sqlserver.sql_text,sqlserver.username))
ADD TARGET package0.ring_buffer
WITH (EVENT_RETENTION_MODE=NO_EVENT_LOSS)
GO
and execute the following script for removing any potential execution plan from the proc cache:
DBCC FREEPROCCACHE
Now we shall need to execute the following complex query a couple of times (at least 3, because I have configured Optimize for ad hoc workloads on my server previously:
declare @res as Decimal(9,3);

select @res = Max(SalesAmount) over ( order by DateKey )
		from dbo.FactOnlineSales sales
			inner join dbo.DimPromotion prom
			on sales.PromotionKey = prom.PromotionKey
	where prom.DiscountPercent = 0
			and DateKey < '2009-01-01'
	order by sales.SalesOrderLineNumber desc, prom.PromotionLabel;
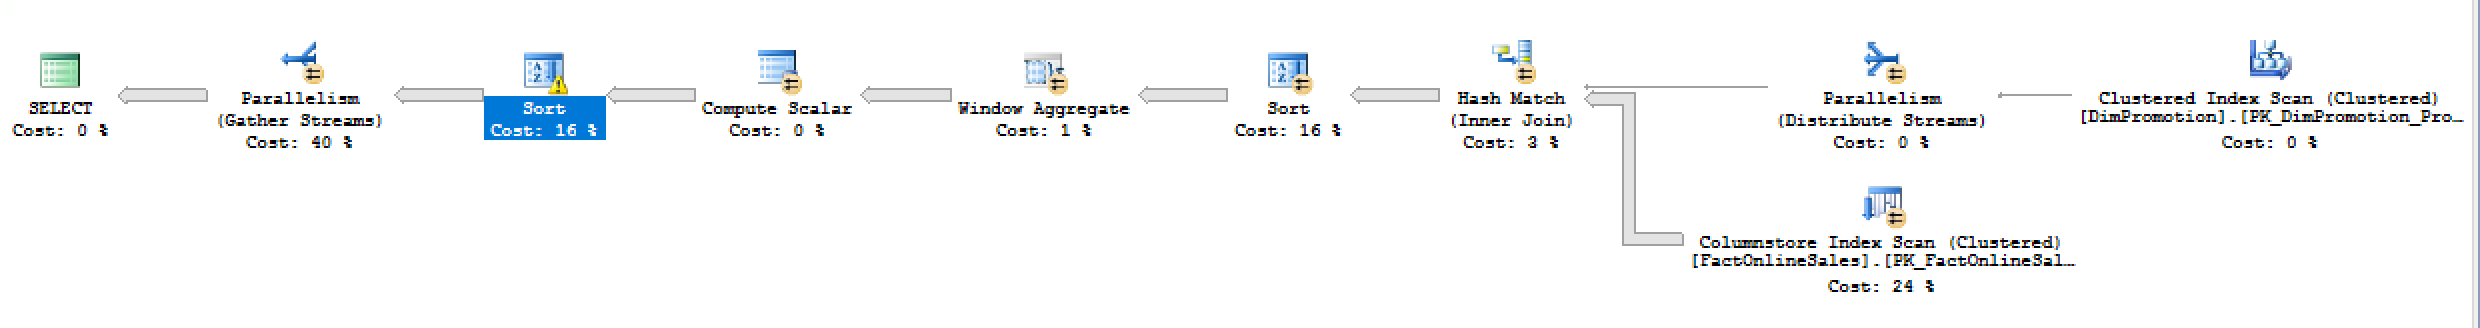
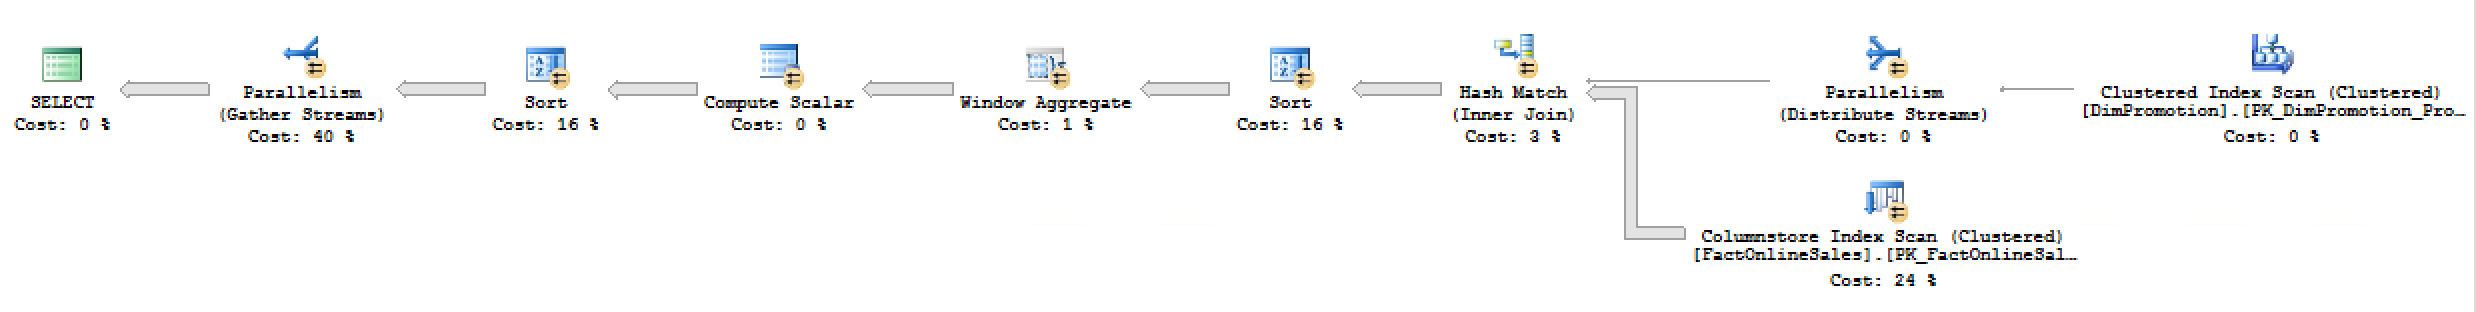
On my test VM, it took a little bit over 7 seconds to complete, while definitely spending some time writing and reading to TempDB with the Sort iterator, as you can see on the execution plan below, where I have highlighted the spilling Sort iterator showing a warning sign with detailed information that is has spilled on the level 8 with 4 threads:
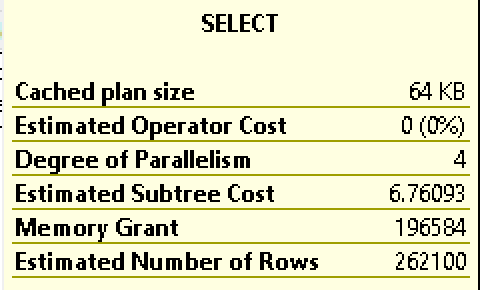 The memory grant as seen on the screenshot on the left is around 195 MB and the actual memory fraction for the spilling sort iterator is 1 for both input and the output, meaning that supposedly 100% of the available memory was given to the iterator to complete the task.
This is a typical situation where the Cardinality Estimation simply can't calculate all the parameters and dependencies correctly - the expected number of rows coming into the spilling sort iterator is around 10 times less, than in the reality (262100 vs 2315471) making it use the TempDB as the temporal storage.
Looking at the 2 configured Extended Events sessions we can see that in Query Optimiser estimates that the 271 MB were needed for the Window Aggregate iterator to function without spilling and that the 53 MB were spilled into TempDB in practice:
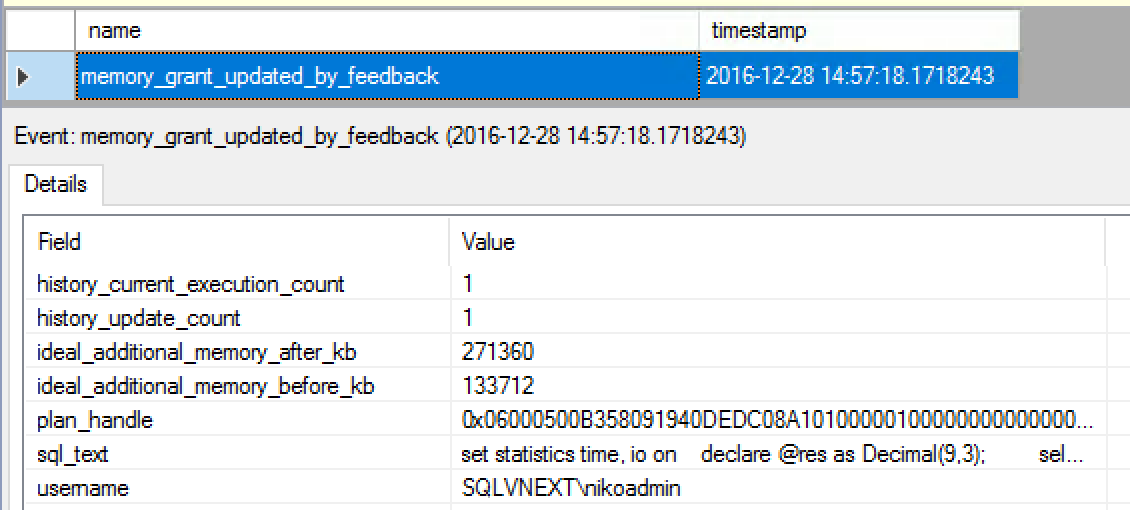
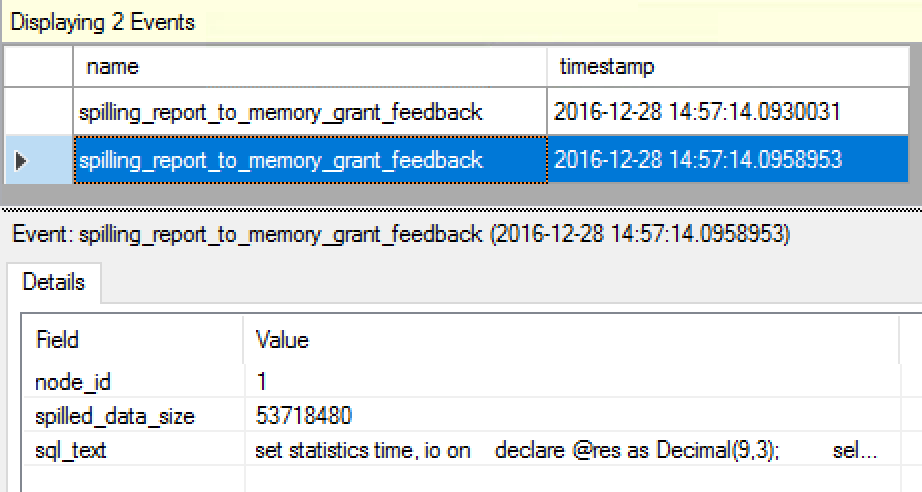
The details of the Extended Events will provide with the information on the missing amount of memory and the steps that were taken since the last optimisation - allowing you to do a great debug of this feature by yourself, if needed.
You can see that the corrected execution plan has no spilling shown in the execution plan and from the execution time standpoint it shows an incredible improvement:
The 1.34 Seconds it takes to execute the updated execution plan in comparison to the 7 seconds spent on the execution plan with the original memory grants are absolutely incredible !
Final Thoughts
The feature is absolutely awesome and so please take it to the test as soon as possible, helping to shape its functionality and improving it before it will land in the next version of SQL Server.
I have seen a couple of bugs already, but that are the initial preview releases and a lot of things will change and improve before the RTM. Do not be shy and make sure that Microsoft hears your voice about this and other query processing features, because they can make our lives incredible easier.
to be continued with Columnstore Indexes – part 94 (“Use Partitioning Wisely”)