Continuation from the previous 34 parts, starting from https://www.nikoport.com/2014/07/20/clustered-columnstore-indexes-part-34-deleted-segments-elimination/
This blog post is about controlling some of the Columnstore Indexes behaviours in less obvious ways – by using Trace Flags & Query Optimiser Rules.
I will be looking into updating this page in the future as the features will be discovered.
IMPORTANT DISCLAIMER: I am not suggesting, I am not recommending, I am not advising you to use the following features.
They are thought only for the situations when things go wrong with the regular default behaviour, which by should easily cover over 90% of the population.
Use it on your own risk, use it on your Test Computer before even on Development Server!
Tuple Mover:
It has been continuously said that the default behaviour of Tuple Mover can be controlled, and its default behaviour is to run in loop every 5 minutes looking for the closed Delta-Stores and convert them into compressed segment. The default machine-orchestrated Tuple Mover has its own particularities, such as that after it finishes compressing a Delta-Store in a single-threaded way, it falls asleep for 15 seconds before looking into finding another Delta-Store.
In some situations, such as if we are looking into compressing every bit of data at one time, in order to get Global Dictionaries or potentially better Local Dictionaries, we might be needing to disable the default Tuple Mover behaviour, but there are no exposed public options for it.
What can we do?
Trace Flag 634:
A very publicly exposed and listed as the officially supported trace flag, we have a Trace Flag 634 which exposes the following behaviour – it disables the background columnstore compression task. Hurray! This is exactly what we have been looking for!
Listed as as a Global Flag only (makes total sense since as far as I understand there is only a single global Tuple Mover and not a local per each DB), it is the goodie that I was looking for some time.
Let’s test it:
DBCC TraceStatus;
The above statement will list you all the Trace flags that are currently enabled, and in my case there are none – for this test.
Now let’s go enable it:
dbcc traceon (634)
dbcc tracestatus;
 As expected, we have a globally active Trace Flag 634 which disables Tuple Mover from running, but let us test it with some data:
We shall load 8 full Delta-Stores and observe their behaviour with the time, I have to warn you that it might take some time on your computer:
declare @i as int;
set @i = 1;

begin tran
while @i <= 1048576
begin
	insert into dbo.BigDataTest
		values (@i);

	set @i = @i + 1;
end;
commit;

GO

-- 33 Seconds, 8 Total Segments
declare @i as int;
declare @max as int;
set @i = 1;

while @i <= 3
begin
	select @max = isnull(max(id),0) from dbo.BigDataTest;

	insert into dbo.BigDataTest
		select id + @max
			from dbo.BigDataTest;

	checkpoint;
	set @i = @i + 1;
end;
I will check on the situation with my Delta-Stores by using the following Script:
select state, state_description, count(*) as 'RowGroup Count'
from sys.column_store_row_groups
where object_id = object_id('BiGDataTest')
group by state, state_description
order by state;
 I can see 1 open & 7 closed Delta-Stores, as expected. Now I need to wait for 5 minutes maximum, and in order to be able to keep on writing I simply executed the following script which queries the status of the Delta-Stores for my table twice, with a short interval of 5 minutes and 30 seconds.
select state, state_description, count(*) as 'RowGroup Count'
from sys.column_store_row_groups
where object_id = object_id('BiGDataTest')
group by state, state_description
order by state;

waitfor delay '00:05:30'

select state, state_description, count(*) as 'RowGroup Count'
from sys.column_store_row_groups
where object_id = object_id('BiGDataTest')
group by state, state_description
order by state;
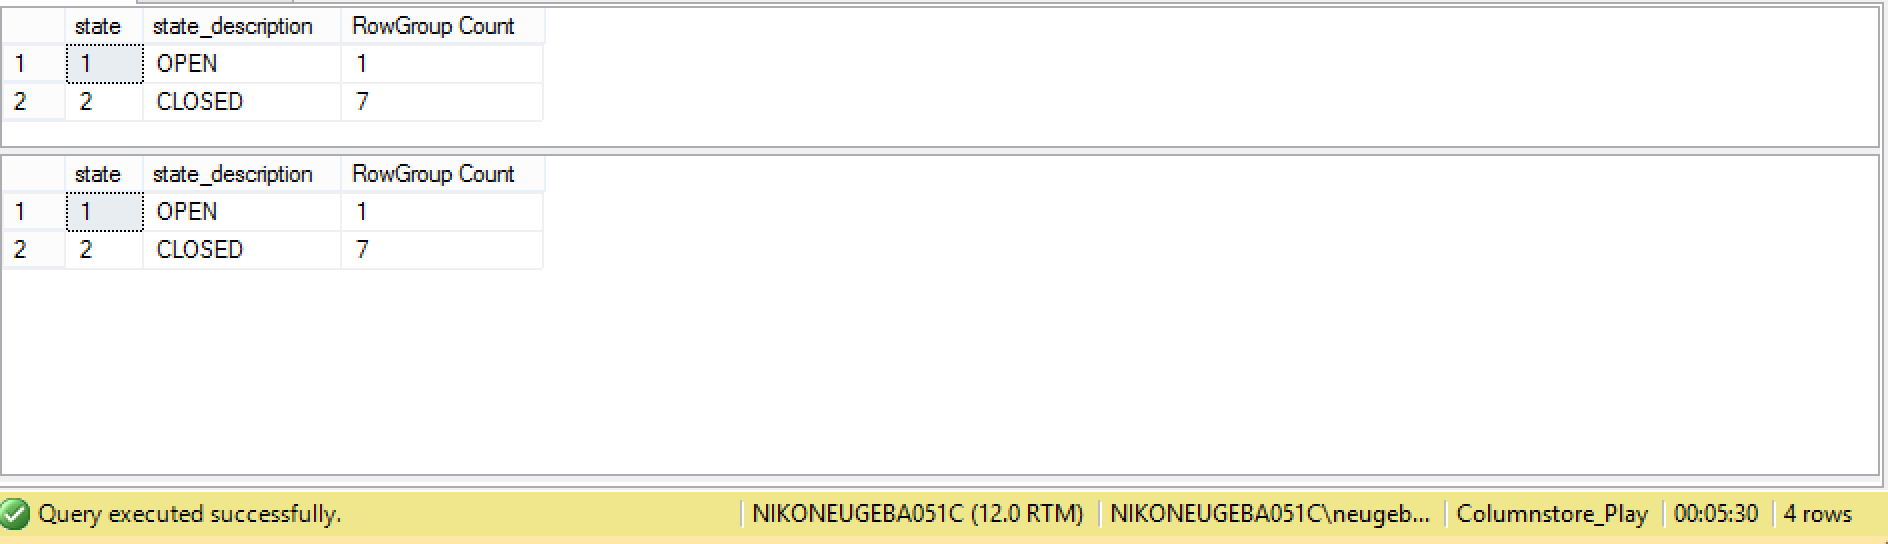 Awesome, the trace flags functions as described! Now we can simply force the Reorganize process with a hint in order to get rid of the open Delta-Store:
alter index PK_BigDataTest on dbo.BiGDataTest
	Reorganize with (COMPRESS_ALL_ROW_GROUPS = ON);

-- Lets Check on the final result
select state, state_description, count(*) as 'RowGroup Count'
from sys.column_store_row_groups
where object_id = object_id('BiGDataTest')
group by state, state_description
order by state;
![]() Now it is correct, all of the Delta-Stores were turned into compressed Segments.
Now it is correct, all of the Delta-Stores were turned into compressed Segments.
Do not forget to disable the Trace-Flag, before continuing!
dbcc traceoff (634);
dbcc TraceStatus;
Segment Elimination:
Trace Flag 646:
Publicly Mentioned by Microsoft in the MSDN article Verifying Columnstore Segment Elimination, this flag serves for getting detailed information on which Columnstore were eliminated by the Query Optimiser right into the error log.
Important notice is that this unsupported trace flag should be used at the global (instance) level.
Consider the following example:
create table dbo.MaxDataTable(
	c1 bigint,
	c2 numeric (36,3),
	c3 bit,
	c4 smallint,
	c5 decimal (18,3),
	c6 smallmoney,
	c7 int,
	c8 tinyint,
	c9 money,
	c10 float(24),
	c11 real,
	c12 date,
	c13 datetimeoffset,
	c14 datetime2 (7),
	c15 smalldatetime,
	c16 datetime,
	c17 time (7),
	c18 char(100),
	c19 varchar(100),
	c20 nchar(100),
	c21 nvarchar(100),
	c22 binary(8),
	c23 varbinary(8),
	c24 uniqueidentifier,
);
GO

-- Insert 2.000.000+ rows in order to get a couple Row Groups
declare @i as int;
declare @max as int;
select @max = isnull(max(C1),0) from dbo.MaxDataTable;
set @i = 1;

begin tran
while @i <= 2148576
begin
	insert into dbo.MaxDataTable
		default values

	set @i = @i + 1;
end;
commit;


-- Update our table with some pretty random data
with updTable as
	(
	select *
		, row_number() over(partition by C1 order by C1) as rnk
		from dbo.MaxDataTable
	)
update updTable
	set C1 = rnk,
		C2 = ABS(CHECKSUM(NewId())) % 142359.0,
		C3 = 1,
		C4 = cast(ABS(CHECKSUM(NewId())) % 10000 as smallint),
		C5 = ABS(CHECKSUM(NewId())) % 242359.0,
		C6 = rnk / ABS(CHECKSUM(NewId())) % 242359.0,
		C7 = ABS(CHECKSUM(NewId())) % 2000000,
		C8 = ABS(CHECKSUM(NewId())) % 255,
		C9 = rnk / ABS(CHECKSUM(NewId())) % 242359.0,
		C10 = rnk / ABS(CHECKSUM(NewId())) % 242359.0,
		C11 = rnk / ABS(CHECKSUM(NewId())) % 242359.0,
		C12 = getDate(),
		C14 = DATEADD(day, (ABS(CHECKSUM(NEWID())) % 65530), 0),
		C15 = DATEADD(day, (ABS(CHECKSUM(NEWID())) % 65530), 0),
		C16 = DATEADD(day, (ABS(CHECKSUM(NEWID())) % 65530), 0),
		C17 = getDate(),
		C18 = cast( ABS(CHECKSUM(NewId())) % 242359.0 as char(25)),
		C19 = cast( ABS(CHECKSUM(NewId())) % 232659.0 as varchar(25)),
		C20 = cast( ABS(CHECKSUM(NewId())) % 242359.0 as nchar(25)),
		C21 = cast( ABS(CHECKSUM(NewId())) % 232659.0 as nvarchar(25));

-- Let's rebuild our table
alter table dbo.MaxDataTable
	rebuild;

/*************************************************************/
-- Turn on trace
dbcc traceon(3605, -1)
	with no_infomsgs;

-- Turn on segment elimination information
dbcc traceon(646, -1)
	with no_infomsgs;

-- Let us clear Error log
dbcc errorlog
	with no_infomsgs;
go

-- Let us consult information inside Error Log
exec sys.xp_readerrorlog
go

-- A simple query
select C4, count(C1)
	from dbo.MaxDataTable
		where C1 > 103000
	group by C4;
go

-- Turn off segment elimination information
dbcc traceoff(3605,646,-1)
	with no_infomsgs;
go

-- View Error Log information
exec sys.xp_readerrorlog;
The Batch Mode:
Sometimes, in some extreme situations, such as when you are putting over 8-10 cores on a single query, or by a simple bug, you might be having some bad results with the Batch Mode, and so there are a couple of ways of forcing Query Optimiser into executing your Columnstore query into Row Mode.
Please make sure that this is necessary, because your situation should be really extraordinary for this to happen. I always recommend considering Resource Governor usage in order to limit the number of cores, then into forcing Query Optimiser, which is being written by some of the smartest people on this planet.
Trace Flag 9453:
With all the credit for this one going to the one and only Paul White, here is an undocumented & unsupported trace flag that forces your query/queries to be executed in Row Mode.
As it is known, we can enable a non-global Trace flag on a query, on a single connection or on the whole instance of SQL Server. I will start with enabling it on a single query, in order to show what happens with the execution plan:
Let's execute the following queries, enabling the actual execution plan:
set statistics io ON
set statistics time ON

select prod.ProductName, sum(sales.SalesAmount) as SoldAmount
	from dbo.FactOnlineSales sales
		inner join dbo.DimProduct prod
			on sales.ProductKey = prod.ProductKey
		inner join dbo.DimCurrency cur
			on sales.CurrencyKey = cur.CurrencyKey
		inner join dbo.DimPromotion prom
			on sales.PromotionKey = prom.PromotionKey
		inner join dbo.DimCustomer cust
			on sales.CustomerKey = cust.CustomerKey
	where (cur.CurrencyName = 'USD')
		and prom.EndDate <= '2009-01-01'
	group by prod.ProductName
	order by sum(sales.SalesAmount) desc
	option( recompile );


select prod.ProductName, sum(sales.SalesAmount) as SoldAmount
	from dbo.FactOnlineSales sales
		inner join dbo.DimProduct prod
			on sales.ProductKey = prod.ProductKey
		inner join dbo.DimCurrency cur
			on sales.CurrencyKey = cur.CurrencyKey
		inner join dbo.DimPromotion prom
			on sales.PromotionKey = prom.PromotionKey
		inner join dbo.DimCustomer cust
			on sales.CustomerKey = cust.CustomerKey
	where (cur.CurrencyName = 'USD')
		and prom.EndDate <= '2009-01-01'
	group by prod.ProductName
	order by sum(sales.SalesAmount) desc
	option( recompile, querytraceon 9453 );
It is absolutely remarkable the difference that the presence of the Batch Mode brings: we are not talking about some small percentage, but as I use to say in my presentations and workshops – the true difference between the performance of Columnstore & Rowstore at the moment is the Batch Mode.
Take a look at the execution times – around 10 times for the elapsed times and around 20 times for the CPU times for this particular query. In real life it will vary depending on a number of factors, but such difference can't be faked unless there is a major difference in architecture of the solution.
 SQL Server Execution Times:
   CPU time = 453 ms,  elapsed time = 262 ms.

 SQL Server Execution Times:
   CPU time = 9577 ms,  elapsed time = 2919 ms.
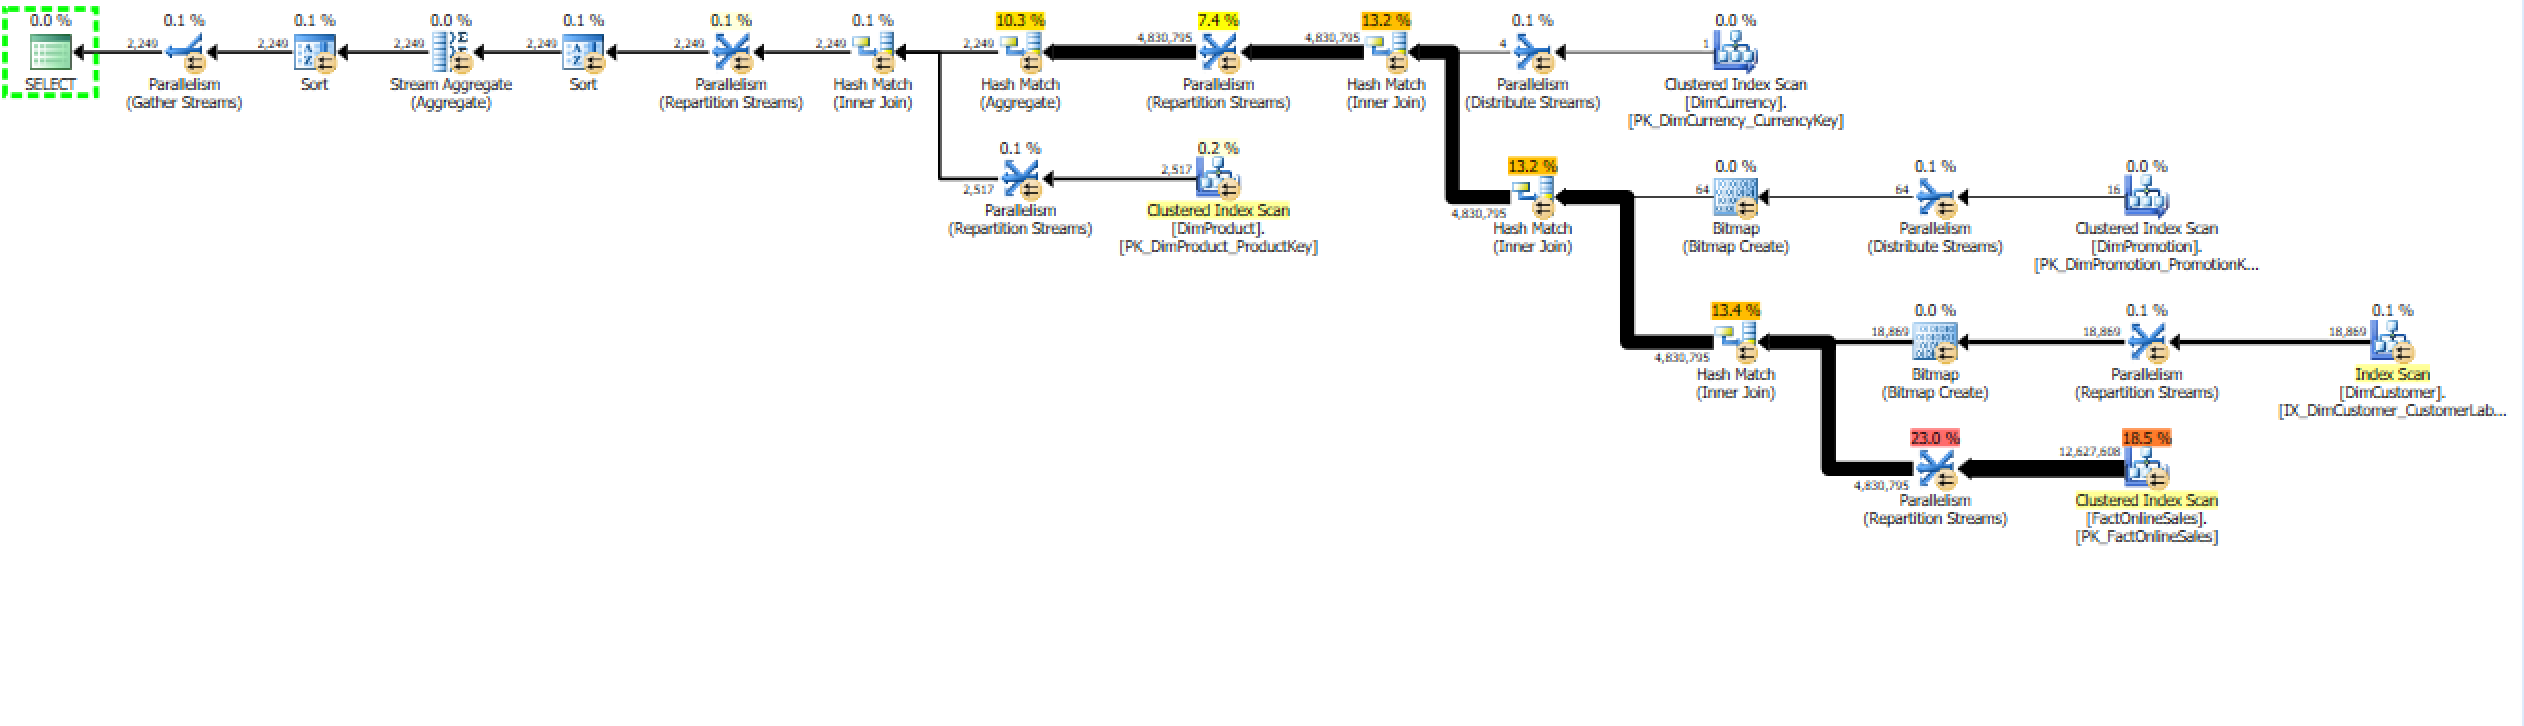
I decided to go and consult the execution plan as well as the execution plans in my favourite performance tool – SQLSentry Plan Explorer - it's free and it is absolutely beyond awesome.
This is a Batch Mode execution plan:

and here is a Row Mode execution plan:
There are a couple of key differences between those execution plans, but I will get into Batch Mode details, once I will start publishing it's own series, hopefully sometime in August.
![]()
From the execution statistics perspective we can see that the number of reads is almost the same (the difference is absolutely irrelevant and it corresponds to the used Workfiles for Hash Match operations I suspect).
You can browse through the results seeing that this times my times for Duration & CPU are even more distinctive.
The number of Parallel Operations is showing that more operations are running together in the same execution context, which is known to give better overall performance.
The other important difference is the exchange of the Hash Match from the Batch Mode with an additional Sort Operator for the Row Mode Execution. You can see 2 Sort Operators (which are working on different expressions) separated by the Steam Aggregate at the very beginning of the execution plan.
We can naturally enable this trace flag on session level or even on the global level, but those are even more extreme measures.
Query Rules:
There are a number of Query Rules that might be enforced in order to improve the final result when Batch Mode is behaving badly, but notice:
- Query Rules might change not only from Version to Version but also from Service Pack to Service Pack or even from Cummulative Update to Cummulative Update.
My deepest thanks go to Benjamin Nevarez who helped me understand them a much better, and some amazing articles from Paul White pointing into right direction.
EnforceBatch, EnforceRow (SQL Server 2014)
GbAggToBatchGbAgg (SQL Server 2012)
are some of the Query Optimiser Rules (yes, there are more of them, which can allow you to do some more specific or granular forcing of the Query Optimiser).
In order to force Clustered Columnstore Indexes into executing in Row Mode on SQL Server 2014 (RTM-CU2) use the following example:
set statistics io ON
set statistics time ON

select prod.ProductName, sum(sales.SalesAmount) as SoldAmount
	from dbo.FactOnlineSales sales
		inner join dbo.DimProduct prod
			on sales.ProductKey = prod.ProductKey
		inner join dbo.DimCurrency cur
			on sales.CurrencyKey = cur.CurrencyKey
		inner join dbo.DimPromotion prom
			on sales.PromotionKey = prom.PromotionKey
		inner join dbo.DimCustomer cust
			on sales.CustomerKey = cust.CustomerKey
	where (cur.CurrencyName = 'USD')
		and prom.EndDate <= '2009-01-01'
	group by prod.ProductName
	order by sum(sales.SalesAmount) desc
	option (recompile, queryruleoff EnforceBatch);


select prod.ProductName, sum(sales.SalesAmount) as SoldAmount
	from dbo.FactOnlineSales sales
		inner join dbo.DimProduct prod
			on sales.ProductKey = prod.ProductKey
		inner join dbo.DimCurrency cur
			on sales.CurrencyKey = cur.CurrencyKey
		inner join dbo.DimPromotion prom
			on sales.PromotionKey = prom.PromotionKey
		inner join dbo.DimCustomer cust
			on sales.CustomerKey = cust.CustomerKey
	where (cur.CurrencyName = 'USD')
		and prom.EndDate <= '2009-01-01'
	group by prod.ProductName
	order by sum(sales.SalesAmount) desc
	option( recompile, queryruleoff EnforceRow );
Both of those queries will be executed in the Row Mode with the usage of those specific QueryRuleOff hints in SQL Server 2014.
To be updated :)
to be continued with Clustered Columnstore Indexes – part 36 (“Maintenance Solutions for Columnstore”)