This blog post is a part of the whole Batch Mode series, which can be found at the Nikoport Batch Mode page.
With the appearance of the CTP 3.2 of the Sql Server 2019 and being almost a year of the public CTPs (Community Technology Previews) releases, it feels like the Release Candidates are approaching and that the RTM (release to manufacturing) is already on the final track (I guess everyone’s bet is on the week of Microsoft Ignite and PASS Summit in the early November of 2019).
Armed with these thoughts I decided to come back to the topic I have been playing with for almost a year – the TPC-H queries to see how good the Batch Execution Mode will perform against the Rowstore Indexes and this blog post is a fair attempt at viewing this improvement through the lenses of the more complex queries, which are makes part of the test procedure for every modern database vendor.
The Setup
For the testing part I decided to take 2 versions of the self-generated TPC-H Databases with the help of HammerDB – the 10GB & the 100GB ones, where I consciously compressed the underlying tables with the PAGE compression, which is to my understanding is different to the tests that Microsoft and other vendors provide (without any kind of compression). I consider the compression to be a very fair point when comparing within SQL Server (and not with other databases), since we have ROW & PAGE compressions in every Sql Server edition starting with the famous Sql Server 2016 Service Pack 1.
For the purposes of tests I have chosen an Azure VM with 8-core CPU with 64GB of RAM and an extra 1 TB drive. This is a pretty average system that should expose the qualities and some of the problems that one should expect from the Batch Execution Mode on the Rowstore Indexes.
Testing on the top system would not provide the clue for the average reader of this blog.
I have also set the Compatibility Level for both databases to 150 and made sure that the Database Scoped Configurations were all enabled:
USE [master]
GO
ALTER DATABASE [tpch_10] SET COMPATIBILITY_LEVEL = 150
GO
USE [tpch_10]
GO
ALTER DATABASE SCOPED CONFIGURATION SET BATCH_MODE_ON_ROWSTORE = ON;
The very same script was applied to the Database TPCH_100_Rowstore – the name is not TPCH_100 on my instance is because the default tests & experiments I am running are against the Columnstore Indexes and that’s what the name is reserved for.
Testing Methodic
I executed every single query enough times so that the execution would be run totally In-Memory (64GB of RAM is enough because we have our data compressed, as I mentioned earlier in the SETUP part). This would allow me to mimic a busy system that has enough resources to process the reading workload. Since the Batch Execution Mode is focusing on the CPU improvements, I decided to sample not only the total elapsed time, but the CPU times so that we can do some judgements of the CPU bandwidth variation. Lowering the CPU consumption fo the high-demanding CPU queries is a key in order to improve the overall system parallelism (well, watch-out for the memory, of-course).
Each successful execution was sampled at least 3 (and in some query cases over 5 times) and then the result would be averaged, so that we can have a higher confidence.
22 TPC-H Queries for the 10GB database
On the picture below you can see the total elapsed time results of the 22 queries executed against the 10 GB TPC-H Database:
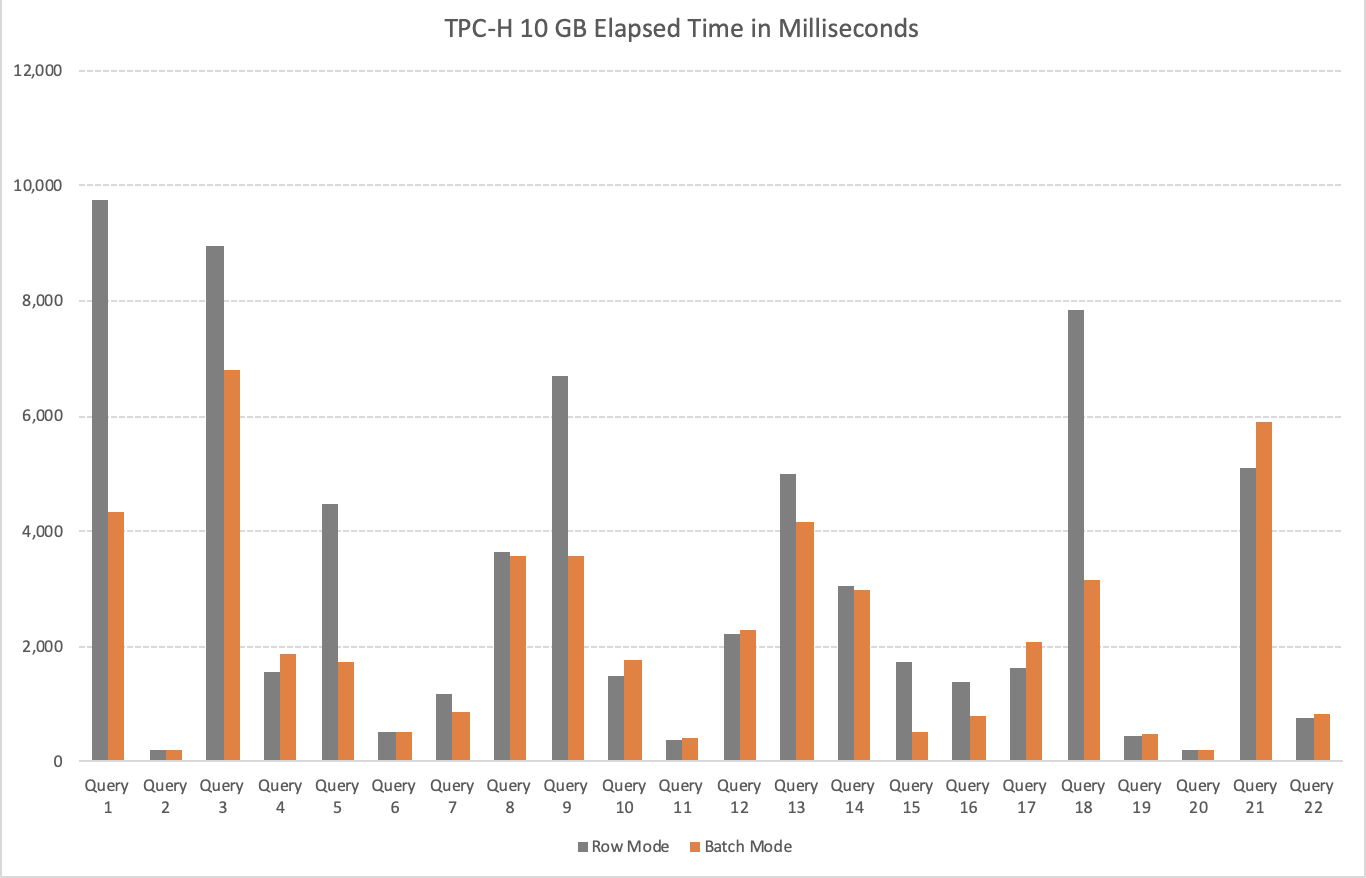
It is not very difficult to recognise that overall the results are incredibly positive, with the queries 1, 3, 5, 9
and 18 delivering huge performance improvements.
An important note here for the queries 2, 19 & 20 that did not trigger Batch Execution Mode on the Rowstore Indexes, which is not very surprising given the relative small amount of data that is needed to be processed.
In total the total elapsed time went down from 68+ seconds to 48+ seconds giving us a total improvement of 19.2 seconds and the average gain of 39%, which is really huge if you think that you can have this improvement just from this particular future by upgrading to Sql Server 2019.
The more complicated part of this test was revealed by the queries 4, 10, 17, 21 & 22 – where all of the Batch Mode enabled scenarios have shown slower performance. As we shall be able to discover a little bit later, some of those queries will eventually improve with the higher scale and higher amount of data in the 100 GB TPC-H tests, but the queries 4, 7 & 17 are pretty persistent pain points for the Batch Mode on the Rowstore Indexes.
The overall number of the queries that were underperforming (I have chosen an arbitrary number of the total elapsed time of being slower than 50 milliseconds) is 22.73%, meaning that 3 out of 4 times one should expect that Batch Execution Mode on the Rowstore Indexes will bring performance improvements.
The CPU execution time side of the story is presented on the image below:
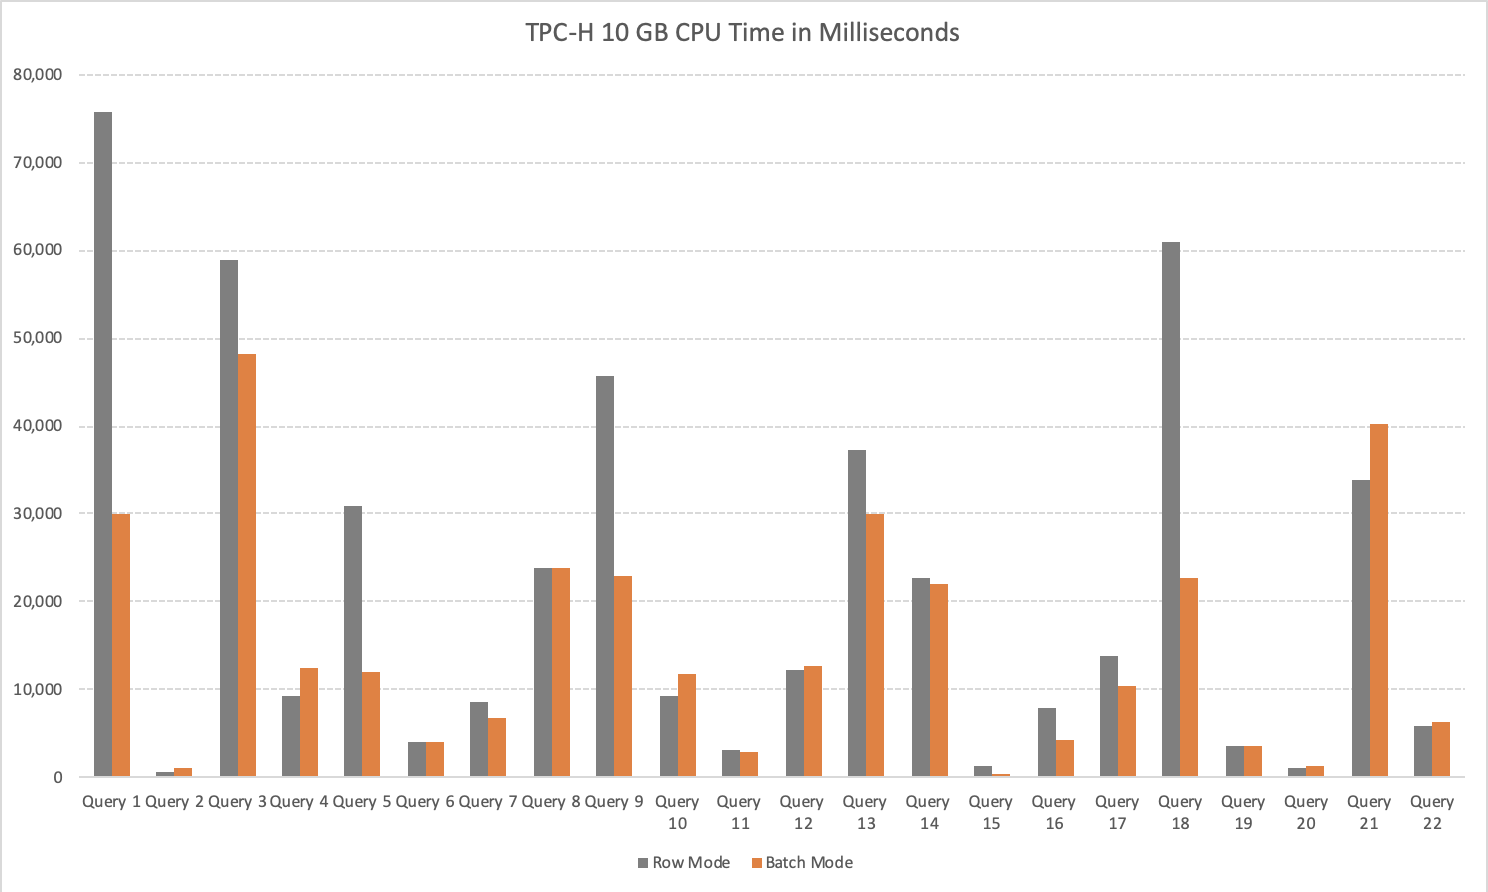
The overall picture (with just a couple of complex exceptions) is extremely similar to the elapsed time and the overall numbers are extremely positive with over 42% of the spent CPU Time improvement, 140 seconds less time spent (2 minutes and 20 seconds).
The usual suspects, the queries 4, 17 & 21 are consuming more CPU resources with Batch Execution Mode on Rowstore Indexes then with the good old default Row Execution Mode on Rowstore Indexes.
The Raw Results
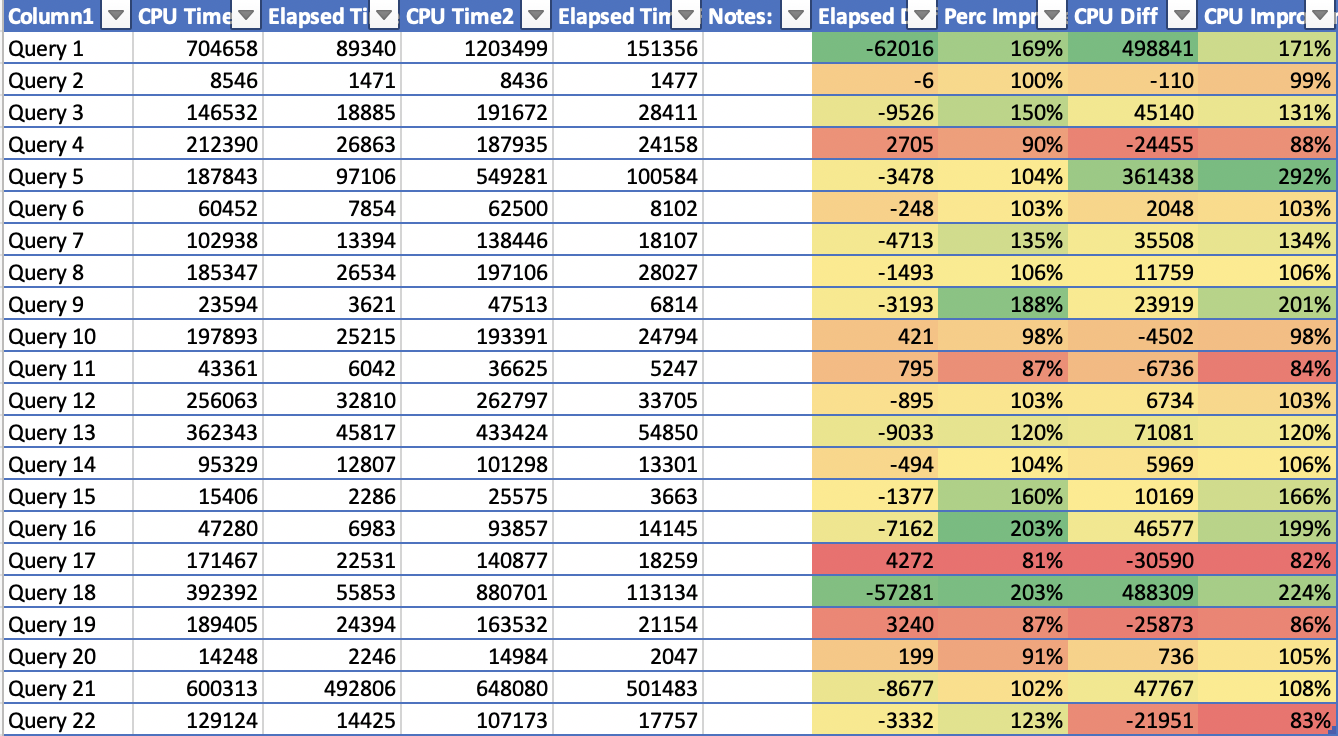
If you are interested in the raw results, here they are on the image below:

With that in mind, I suggest we dive into the particular queries that represents the concrete interest.
Those little husky details
Query 2:
The first query to investigate deeper would be the Query 2, where on the TPCH 10GB Database I was unable to get a Batch Execution Mode and hence both of the execution times were virtually undistinguishable:
-- Query 2
SET NOCOUNT ON
set statistics time,io on

SELECT TOP 100 S_ACCTBAL, S_NAME, N_NAME, P_PARTKEY, P_MFGR, S_ADDRESS, S_PHONE, S_COMMENT
FROM PART, SUPPLIER, PARTSUPP, NATION, REGION
WHERE P_PARTKEY = PS_PARTKEY AND S_SUPPKEY = PS_SUPPKEY AND P_SIZE = 15 AND
P_TYPE LIKE '%%BRASS' AND S_NATIONKEY = N_NATIONKEY AND N_REGIONKEY = R_REGIONKEY AND
R_NAME = 'EUROPE' AND
PS_SUPPLYCOST = (SELECT MIN(PS_SUPPLYCOST) FROM PARTSUPP, SUPPLIER, NATION, REGION
 WHERE P_PARTKEY = PS_PARTKEY AND S_SUPPKEY = PS_SUPPKEY
 AND S_NATIONKEY = N_NATIONKEY AND N_REGIONKEY = R_REGIONKEY AND R_NAME = 'EUROPE')
ORDER BY S_ACCTBAL DESC, N_NAME, S_NAME, P_PARTKEY
OPTION (USE HINT('DISALLOW_BATCH_MODE'));
The execution plan for both queries is presented below:
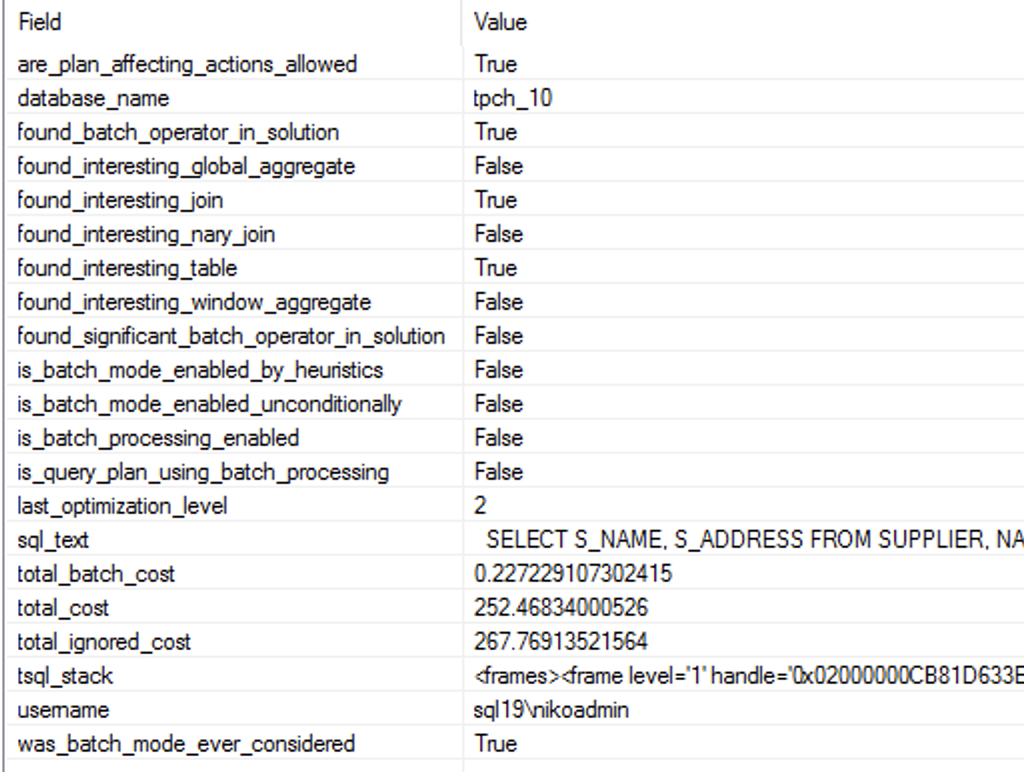
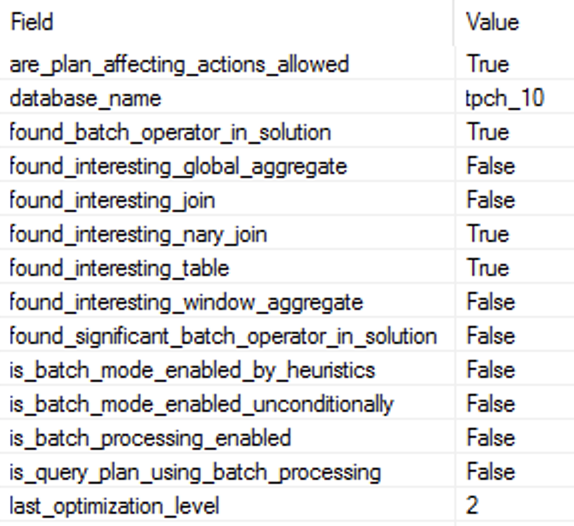 There is no Batch Execution Mode anywhere in the execution plan, and as you can see on the right side the output of the Extended Event batch_mode_heuristics, that I have already described in the Batch Mode – part 3 (“Basic Heuristics and Analysis”). The property is_batch_processing_enabled is set to false while the query itself is indeed representing an interesting table (more than 100.000+ rows) and an interesting n-ary join.
Looking at the real amount of data that was processed and distributed between the 8 cores, I can only arrive to conclusion that a selection of the Batch Execution Mode for this query would result in significantly slower processing, because activating it is simply not worth for just a couple of thousands of rows.
Query 4:
This is the queries that I was running test the results:
-- Query 4
SET NOCOUNT ON;
set statistics time, io on

SELECT O_ORDERPRIORITY, COUNT(*) AS ORDER_COUNT FROM ORDERS
WHERE O_ORDERDATE >= '1993-07-01' AND O_ORDERDATE < dateadd(mm,3, cast('1993-07-01' as date))
AND EXISTS (SELECT * FROM LINEITEM WHERE L_ORDERKEY = O_ORDERKEY AND L_COMMITDATE < L_RECEIPTDATE)
GROUP BY O_ORDERPRIORITY
ORDER BY O_ORDERPRIORITY
option (recompile)

SELECT O_ORDERPRIORITY, COUNT(*) AS ORDER_COUNT FROM ORDERS
WHERE O_ORDERDATE >= '1993-07-01' AND O_ORDERDATE < dateadd(mm,3, cast('1993-07-01' as date))
AND EXISTS (SELECT * FROM LINEITEM WHERE L_ORDERKEY = O_ORDERKEY AND L_COMMITDATE < L_RECEIPTDATE)
GROUP BY O_ORDERPRIORITY
ORDER BY O_ORDERPRIORITY
OPTION (USE HINT('DISALLOW_BATCH_MODE'));
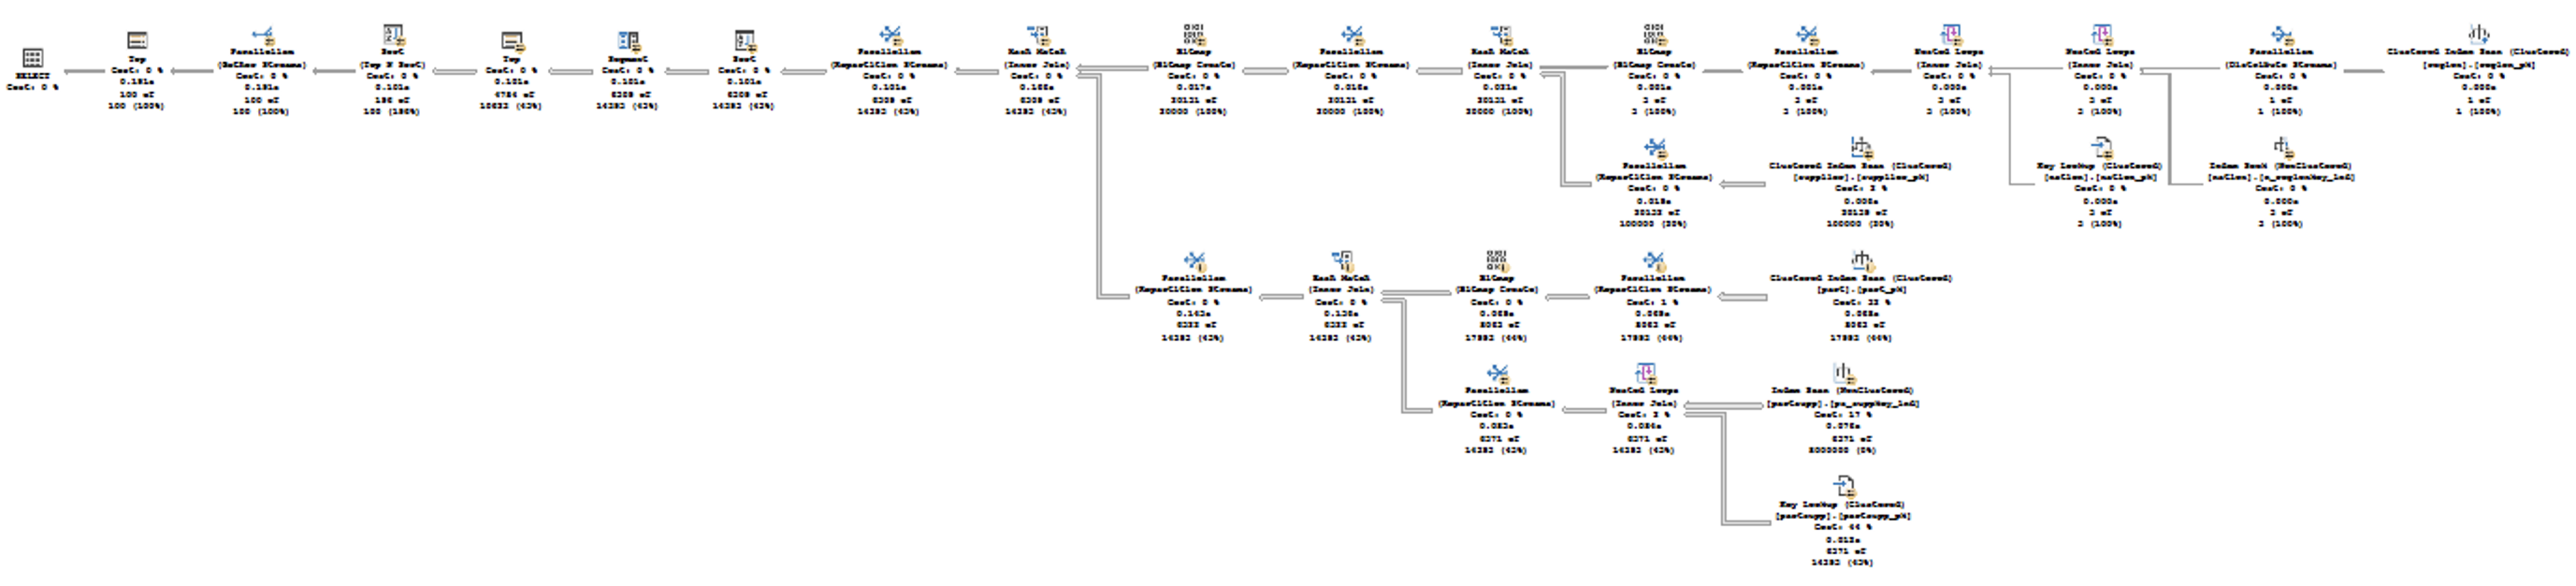
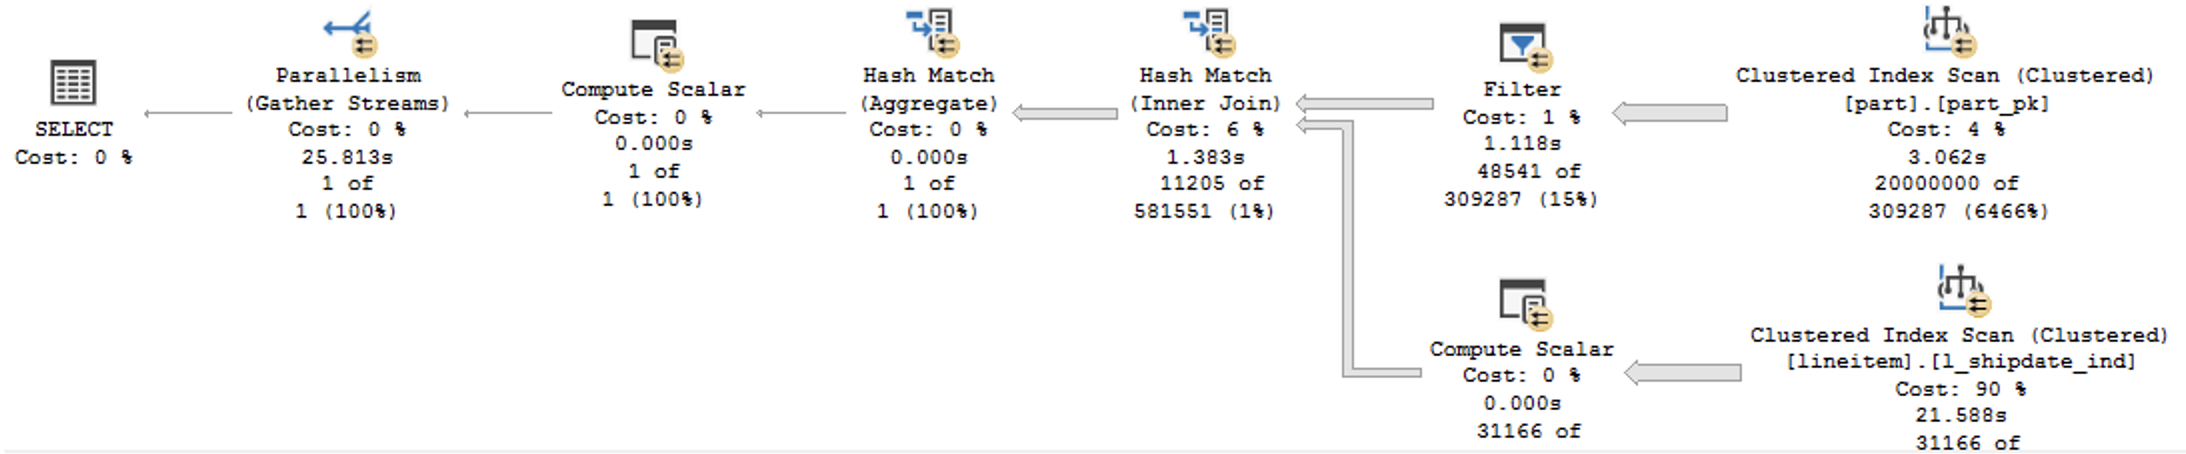
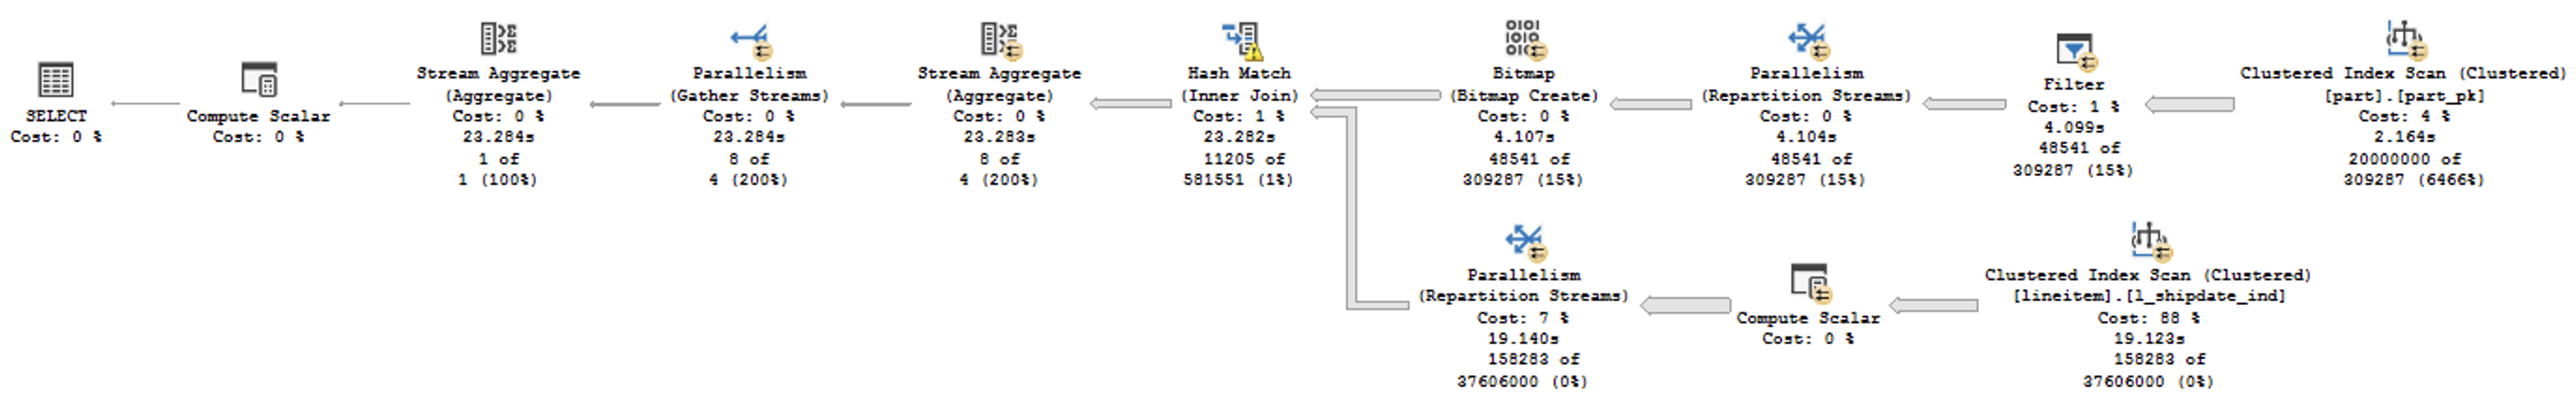
Both execution plans are represented below:
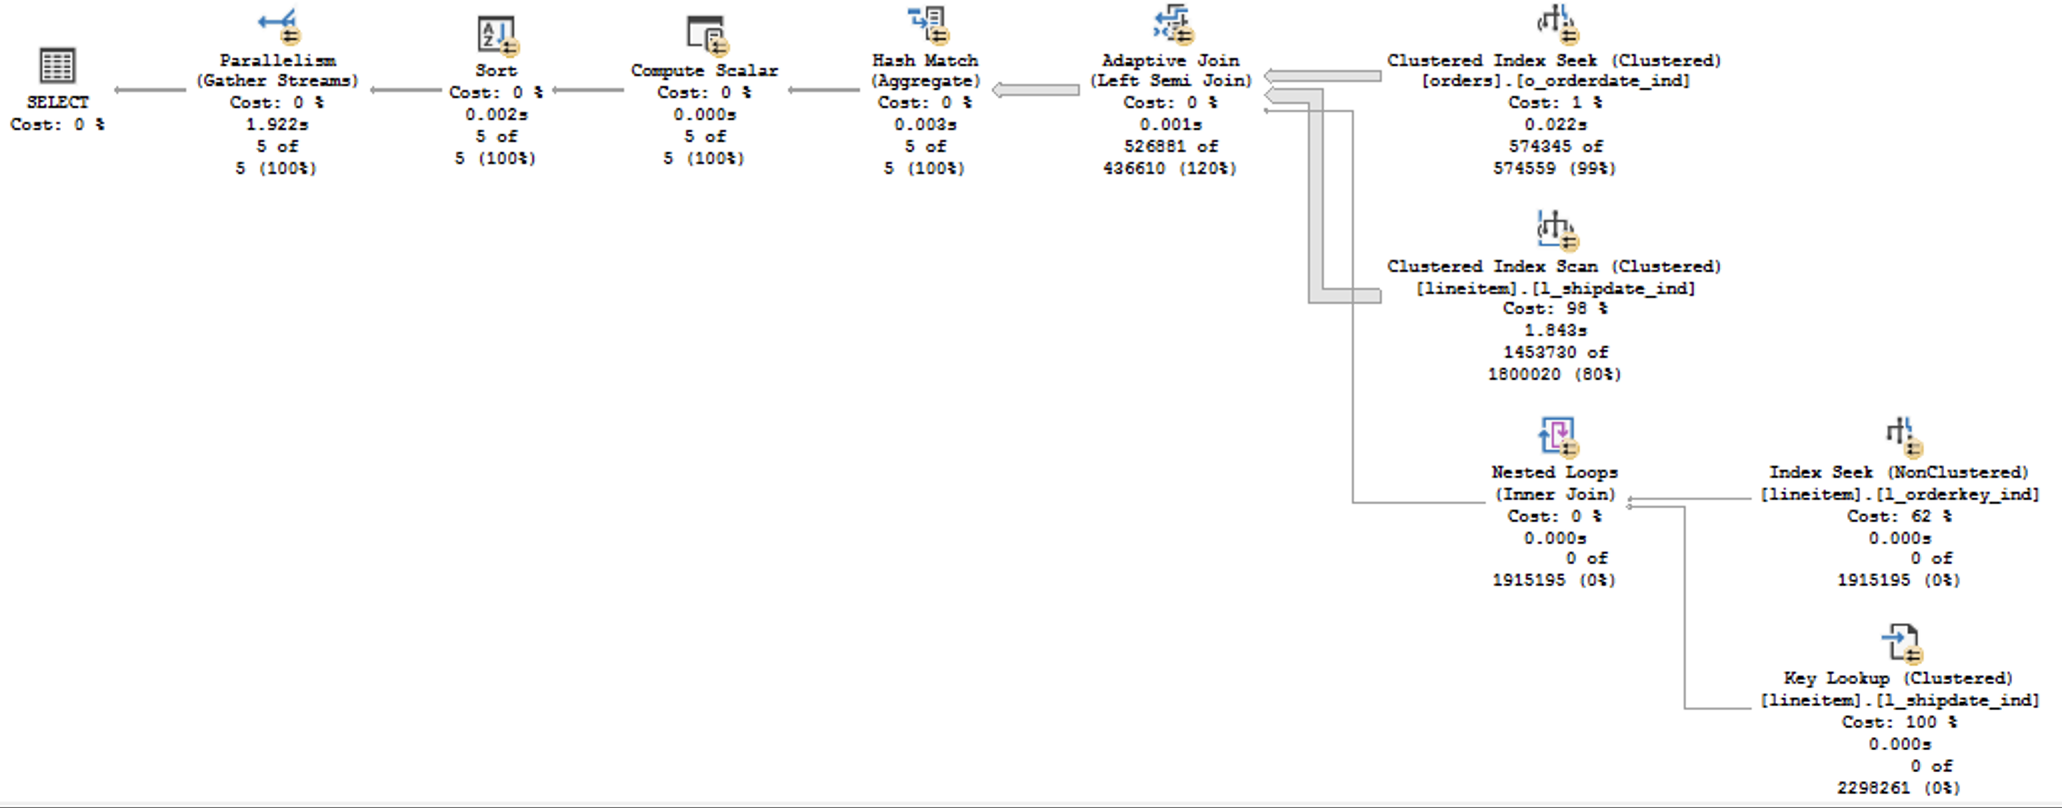
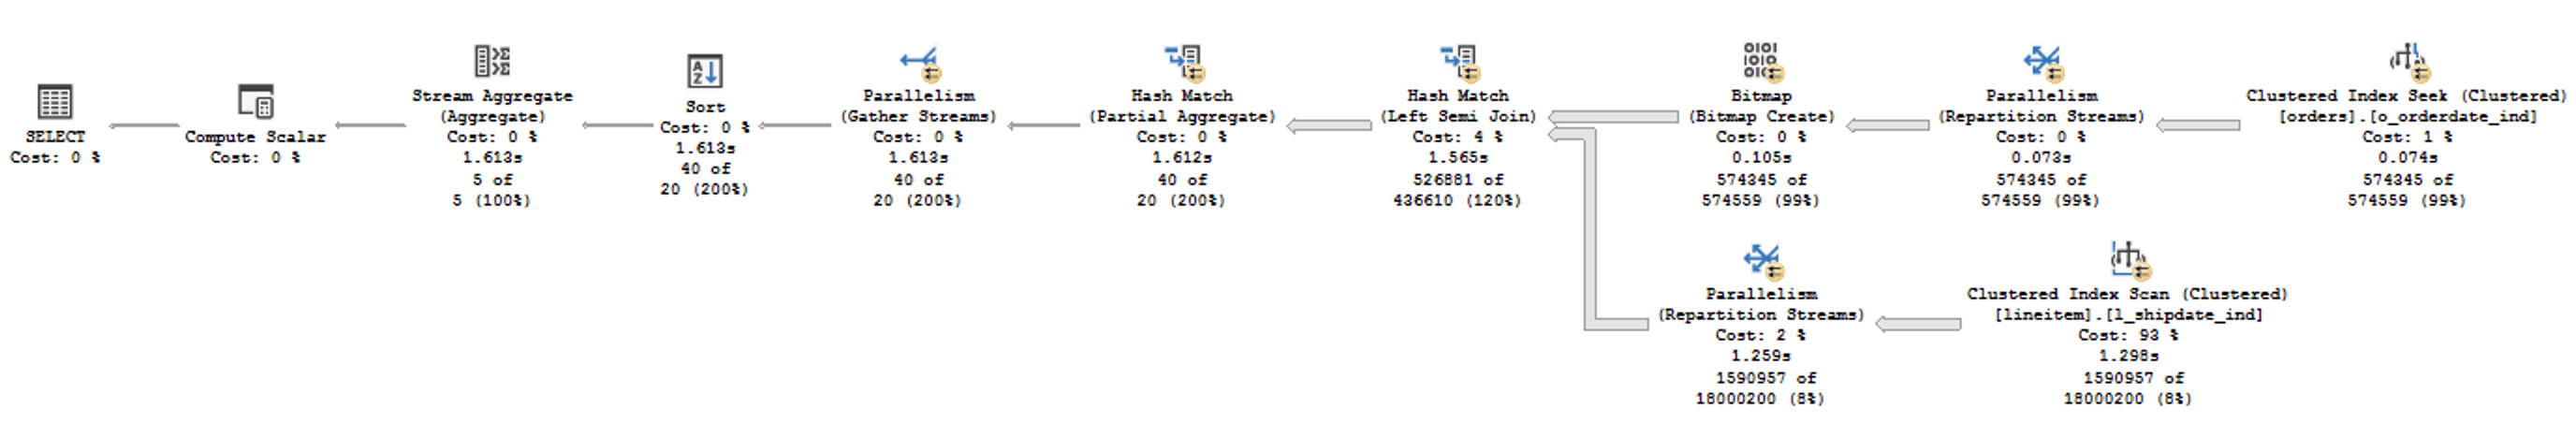
and where you can clearly determine that the first plan, the one with the Batch Execution Mode is the one running Adaptive Join has all the important nodes running with the Batch Execution Mode - everything should have been fine and much fancier, but somehow this query runs significantly slower...
Looking at the execution plans and comparing them visually, one can wonder about the number of rows that are being read and processed by the Clustered Index Scan of the Lineitem table.
In the case of the Execution Plan with the Batch Mode, we have the number of rows read equals to 60000575 - the original cardinality of the table, while for the Execution Plan with the Row Mode the number or rows read was 3662482... almost a half of the number of rows when comparing to the Batch Execution Mode!
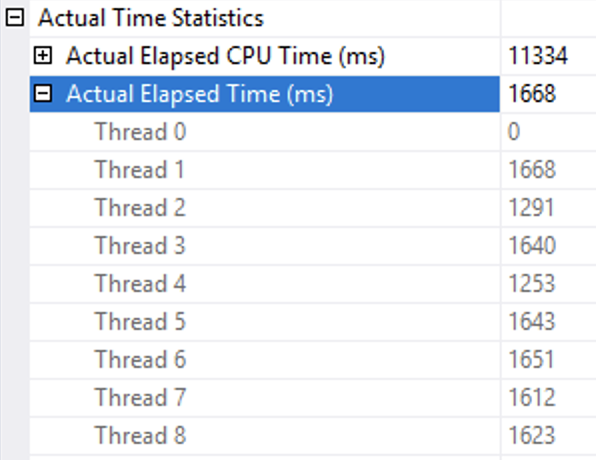
Query 4 Row Mode Exec Details
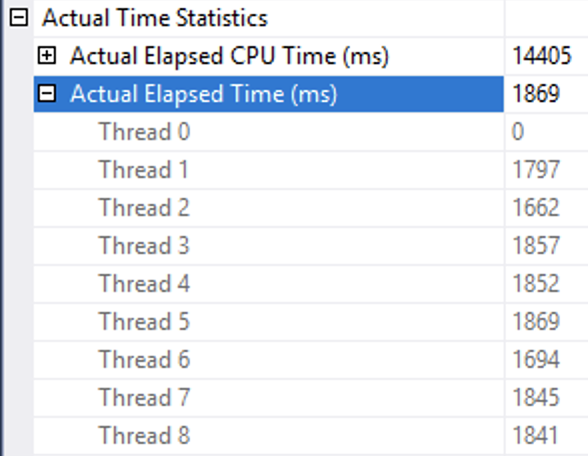
Query 4 Batch Mode Exec Details
Looking deeper into the execution times on the Clustered Index Scan of the Lineitem table one notices that the amount of the CPU time spent on the operation was significantly lower for the Row Execution Mode (11.334 seconds) versus the amount of CPU time spent on the Batch Execution Mode (14.405 seconds). The threads distribution looks very much reasonable and the prevalence of the higher times (1.869 seconds being the maximum) for the Batch Execution Mode is clearly below the results obtained by the Row Execution Mode (1.668 seconds being the maximum).
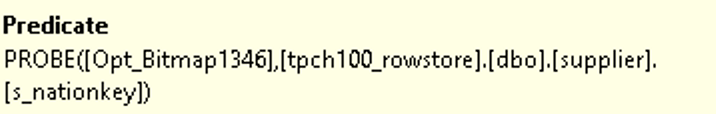
This can only mean that in this situation that the filtering process is what slows down the execution and to be more precise it seems that the inequality search condition is what exactly makes the bitmap filter to go into the wrong direction.
To prove this hipoteses I simply re-executed the query with the searching condition updated to the equality instead of the original inequality search:
-- Query 4 With Equality Search
SET NOCOUNT ON;
set statistics time, io on

SELECT O_ORDERPRIORITY, COUNT(*) AS ORDER_COUNT FROM ORDERS
WHERE O_ORDERDATE >= '1993-07-01' AND O_ORDERDATE < dateadd(mm,3, cast('1993-07-01' as date))
AND EXISTS (SELECT * FROM LINEITEM WHERE L_ORDERKEY = O_ORDERKEY AND L_COMMITDATE = L_RECEIPTDATE)
GROUP BY O_ORDERPRIORITY
ORDER BY O_ORDERPRIORITY
option (recompile)

SELECT O_ORDERPRIORITY, COUNT(*) AS ORDER_COUNT FROM ORDERS
WHERE O_ORDERDATE >= '1993-07-01' AND O_ORDERDATE < dateadd(mm,3, cast('1993-07-01' as date))
AND EXISTS (SELECT * FROM LINEITEM WHERE L_ORDERKEY = O_ORDERKEY AND L_COMMITDATE = L_RECEIPTDATE)
GROUP BY O_ORDERPRIORITY
ORDER BY O_ORDERPRIORITY
OPTION (USE HINT('DISALLOW_BATCH_MODE'));
and the results were 1.652 seconds for the Batch Execution Mode versus the 1.694 seconds for the Row Execution Mode.
Given that the original times were significantly higher, one can only point to the Bitmap Filters and their capability to handle the inequality search.
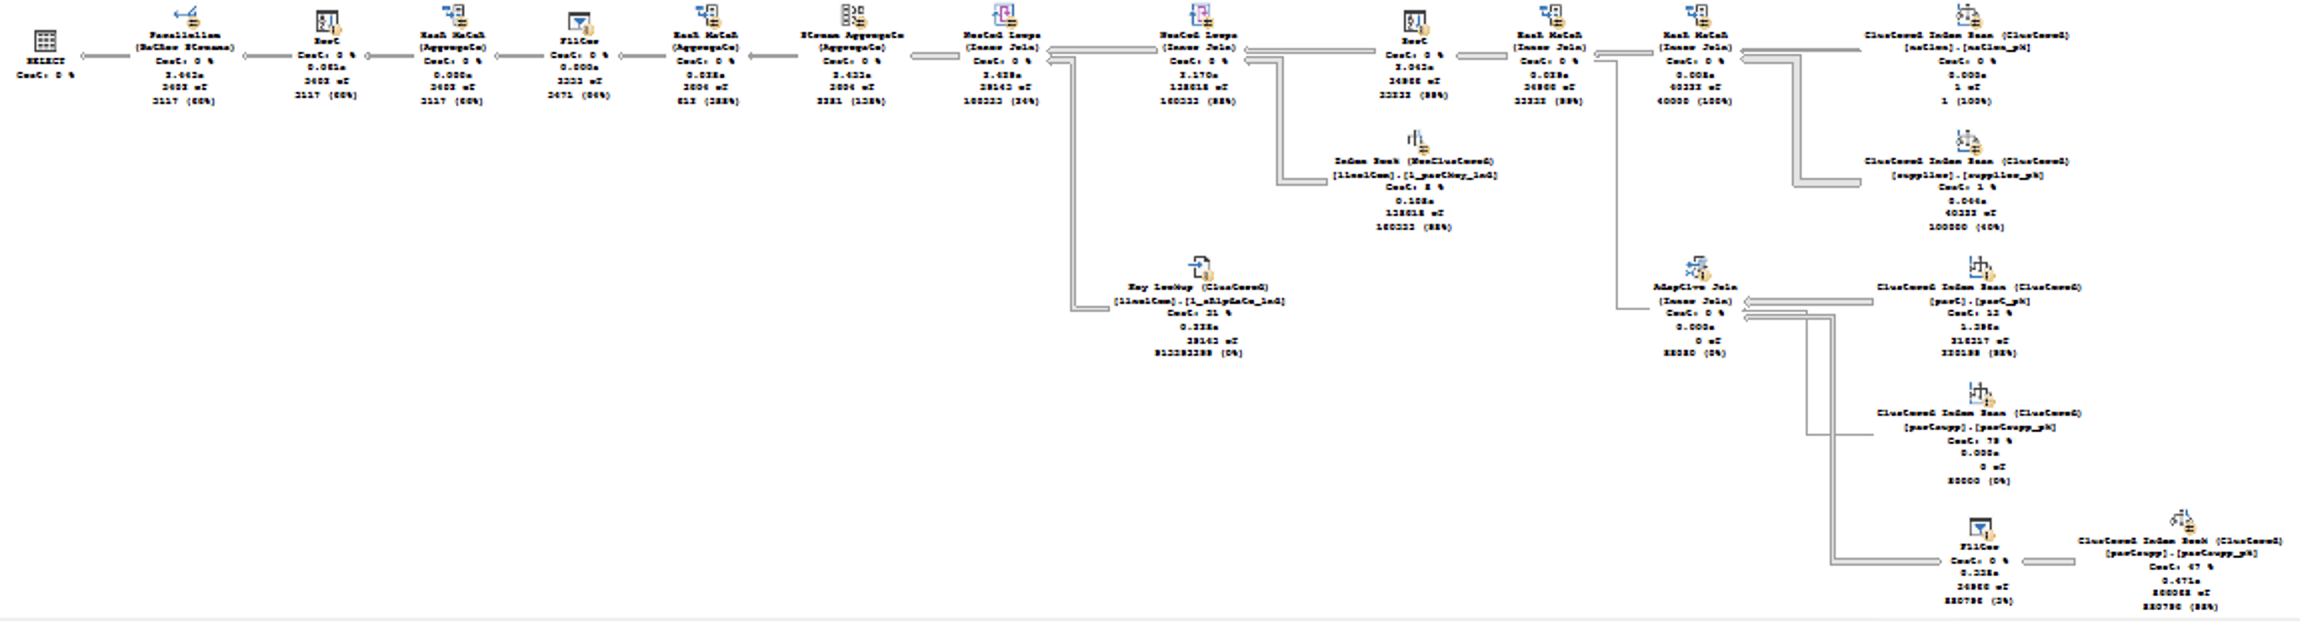
Query 17
The incredibly elusive query 17 is where we are loosing the most performance when working with the Batch Execution Mode on the Rowstore Indexes. the incredible 21% of the performance is lost in this case – 2.082 seconds for the Batch Mode versus the 1.641 seconds for the Row Execution Mode.
Here are the queries that I was using for the test:
set statistics time,io on

SELECT SUM(L_EXTENDEDPRICE)/7.0 AS AVG_YEARLY FROM LINEITEM, PART
WHERE P_PARTKEY = L_PARTKEY AND P_BRAND = 'Brand#23' AND P_CONTAINER = 'MED BOX'
AND L_QUANTITY < (SELECT 0.2*AVG(L_QUANTITY) FROM LINEITEM WHERE L_PARTKEY = P_PARTKEY)


SELECT SUM(L_EXTENDEDPRICE)/7.0 AS AVG_YEARLY FROM LINEITEM, PART
WHERE P_PARTKEY = L_PARTKEY AND P_BRAND = 'Brand#23' AND P_CONTAINER = 'MED BOX'
AND L_QUANTITY < (SELECT 0.2*AVG(L_QUANTITY) FROM LINEITEM WHERE L_PARTKEY = P_PARTKEY)
OPTION (USE HINT('DISALLOW_BATCH_MODE'));
The execution plans are presented below:
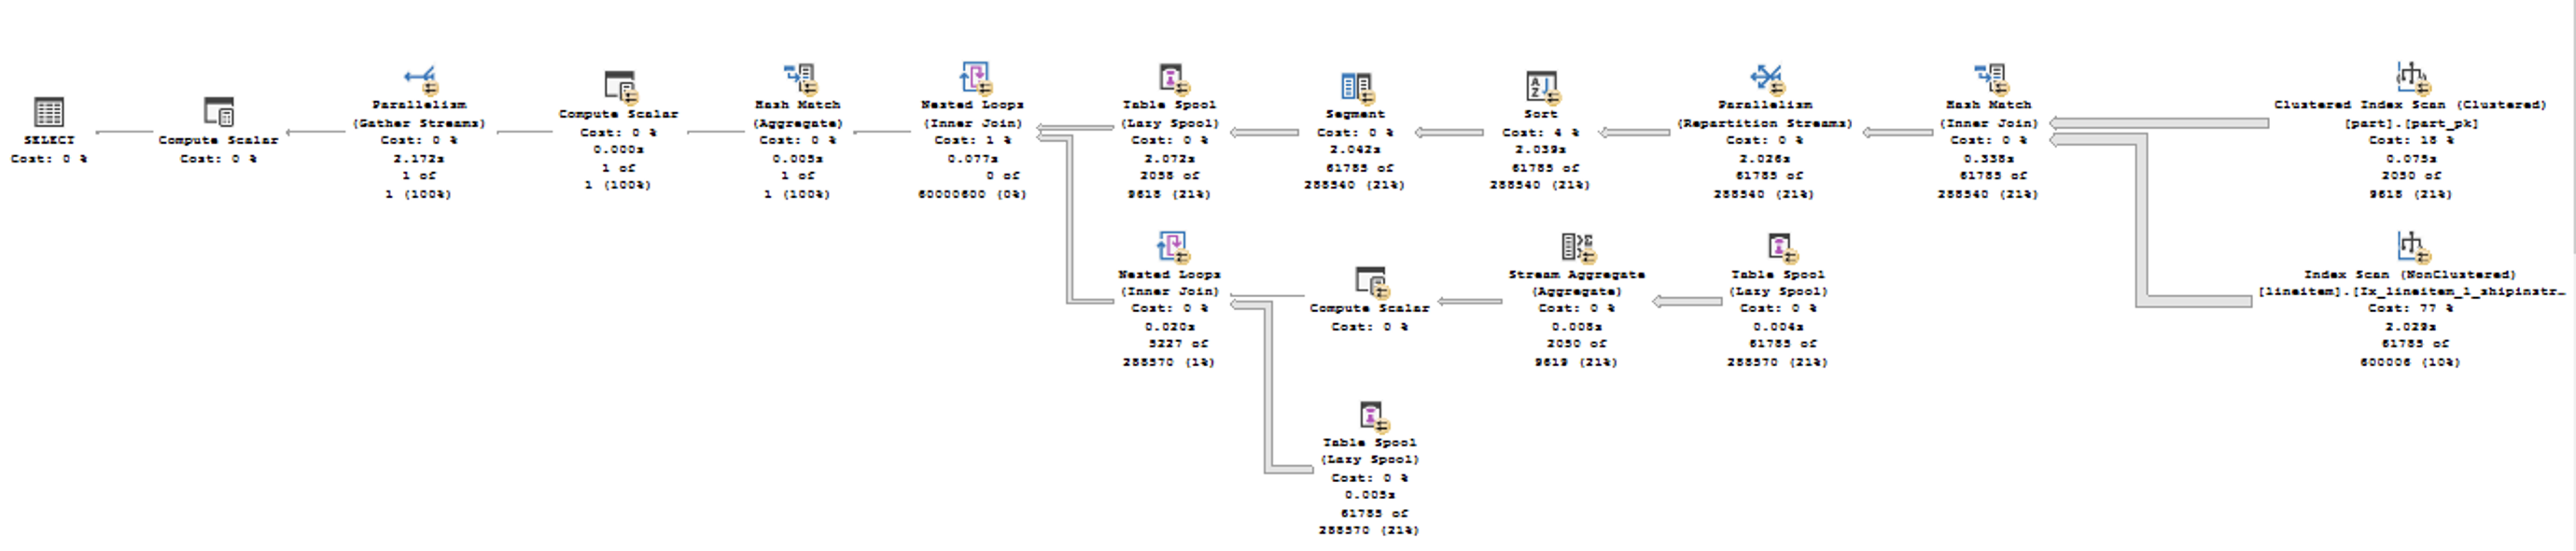
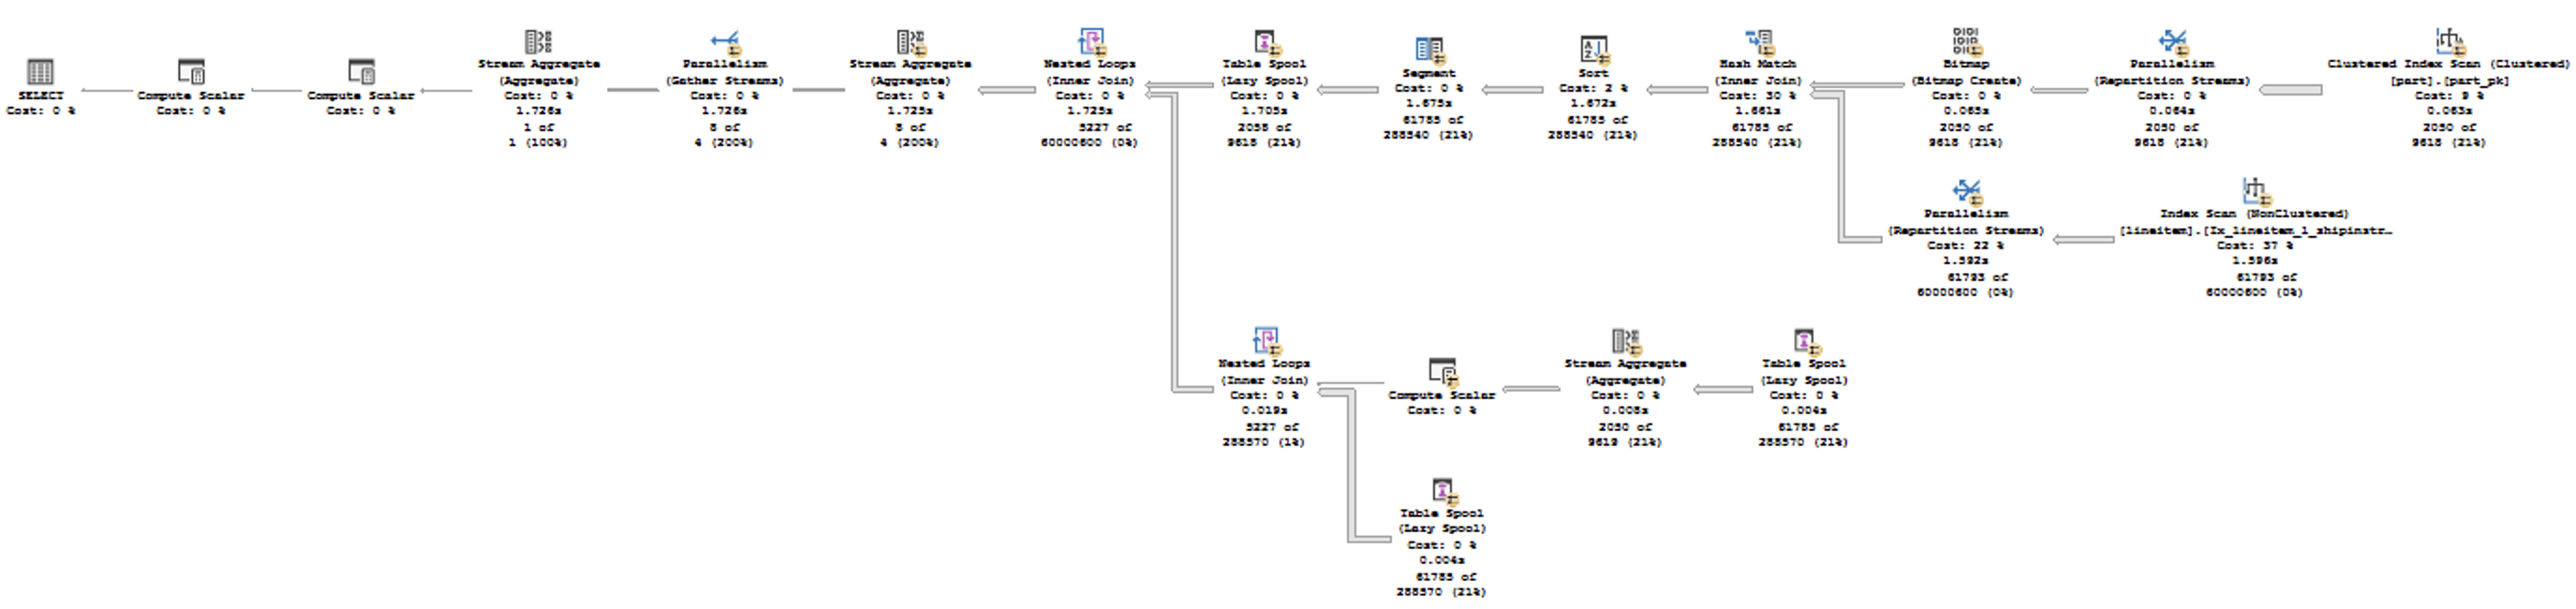
and anyone looking at the details of the execution plans will easily notice that the arrows coming out of the Nonclustered Index scan of the table are much bigger for the first execution plan with the Batch Execution Mode when comparing to the Row Execution Mode.
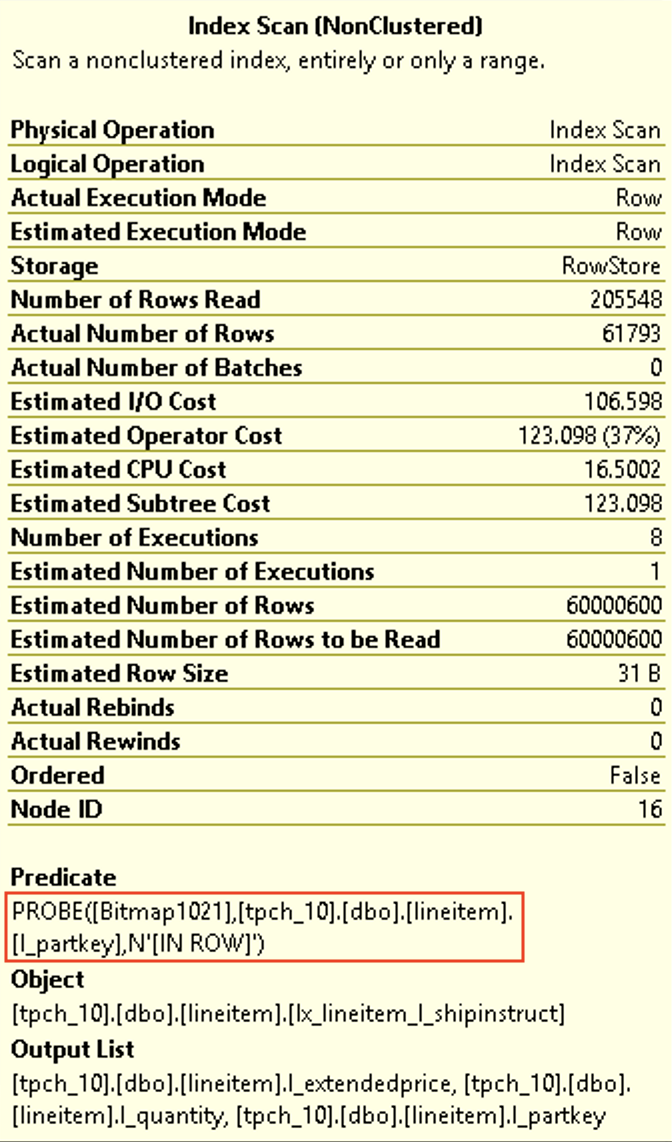
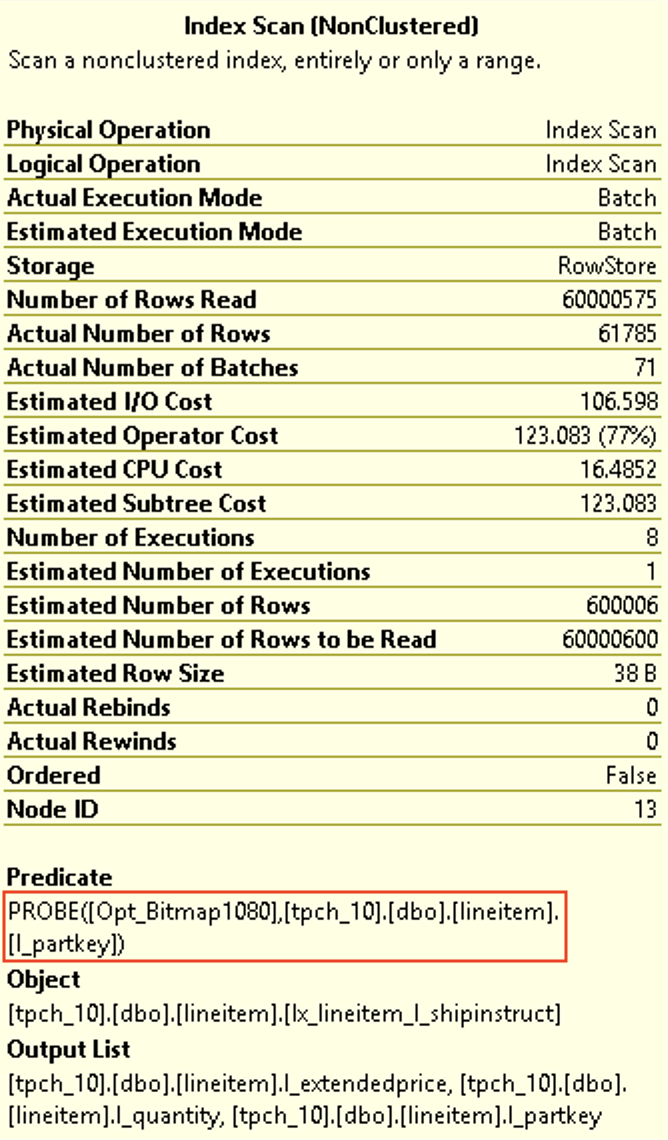 Take a look at the properties of the Nonclustered Index Scan for the Lineitem table (60 million rows) on the left and notice that indeed we do have a predicate pushdown and on the right side (Row Execution Mode) an extremely similar situation takes place with the same predicate pushdown. Where is the difference and why in the first case we have a little over 60 million rows read and the very same Bitmap Probe is supposedly taking place. The thing is that in the first case (Batch Mode) the probing function is off row and for the Row Execution Mode it is IN-ROW, as indicated on the images. This means that the storage engine is capable (in the case for the Row Execution Mode) of pushing down and doing the filtering of the rows, while for the Batch Execution Mode it has to push the information up and filter it later within the operator itself. This is exactly what gives the huge difference for the performance of this query.
You can safely ignore the missing index suggestion, because its addition will only help the second execution plan, making it execution even faster (to 0.4 seconds delivering a devastating and unrecoverable blow to this comparison), while the first plan with the Batch Execution Mode will continue suffocating with the same execution time.
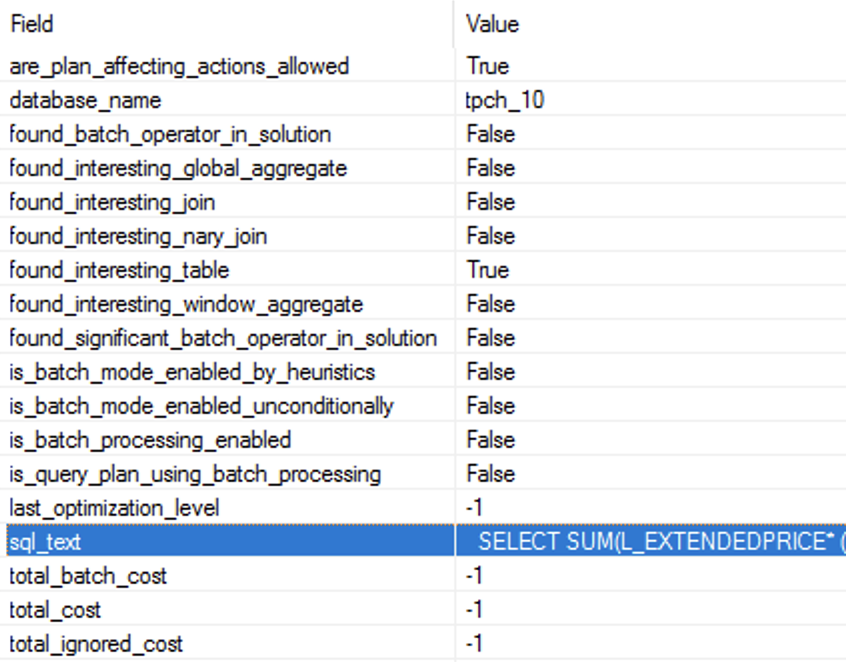
Query 19 & Query 20
For the TPC-H 10 GB Database, both of the queries received no Batch Mode even though one of them (Query 20) was really considered, but was denied because of lack of the potential effective plan:
SELECT SUM(L_EXTENDEDPRICE* (1 - L_DISCOUNT)) AS REVENUE
FROM LINEITEM, PART
WHERE (P_PARTKEY = L_PARTKEY AND P_BRAND = 'Brand#12' AND P_CONTAINER IN ('SM CASE', 'SM BOX', 'SM PACK', 'SM PKG') AND L_QUANTITY >= 1 AND L_QUANTITY <= 1 + 10 AND P_SIZE BETWEEN 1 AND 5
AND L_SHIPMODE IN ('AIR', 'AIR REG') AND L_SHIPINSTRUCT = 'DELIVER IN PERSON')
OR (P_PARTKEY = L_PARTKEY AND P_BRAND ='Brand#23' AND P_CONTAINER IN ('MED BAG', 'MED BOX', 'MED PKG', 'MED PACK') AND L_QUANTITY >=10 AND L_QUANTITY <=10 + 10 AND P_SIZE BETWEEN 1 AND 10
AND L_SHIPMODE IN ('AIR', 'AIR REG') AND L_SHIPINSTRUCT = 'DELIVER IN PERSON')
OR (P_PARTKEY = L_PARTKEY AND P_BRAND = 'Brand#34' AND P_CONTAINER IN ( 'LG CASE', 'LG BOX', 'LG PACK', 'LG PKG') AND L_QUANTITY >=20 AND L_QUANTITY <= 20 + 10 AND P_SIZE BETWEEN 1 AND 15
AND L_SHIPMODE IN ('AIR', 'AIR REG') AND L_SHIPINSTRUCT = 'DELIVER IN PERSON');
SELECT S_NAME, S_ADDRESS FROM SUPPLIER, NATION
WHERE S_SUPPKEY IN (SELECT PS_SUPPKEY FROM PARTSUPP
 WHERE PS_PARTKEY in (SELECT P_PARTKEY FROM PART WHERE P_NAME like 'forest%%') AND
 PS_AVAILQTY > (SELECT 0.5*sum(L_QUANTITY) FROM LINEITEM WHERE L_PARTKEY = PS_PARTKEY AND
  L_SUPPKEY = PS_SUPPKEY AND L_SHIPDATE >= '1994-01-01' AND
  L_SHIPDATE < dateadd(yy,1,'1994-01-01'))) AND S_NATIONKEY = N_NATIONKEY AND N_NAME = 'CANADA'
ORDER BY S_NAME;
You can see both of the images of the Batch Mode Heuristics output for each of the queries below, and I guess that by now you will need no further explanations about them, but should you have doubts - feel free to jump over to the Batch Mode – part 3 (“Basic Heuristics and Analysis”)
22 TPC-H Queries for the 100GB database
Moving on to a more real & interesting database with around of 100 GB of data, as per TPC definition here are the results of the running and measuring the very same 22 queries:
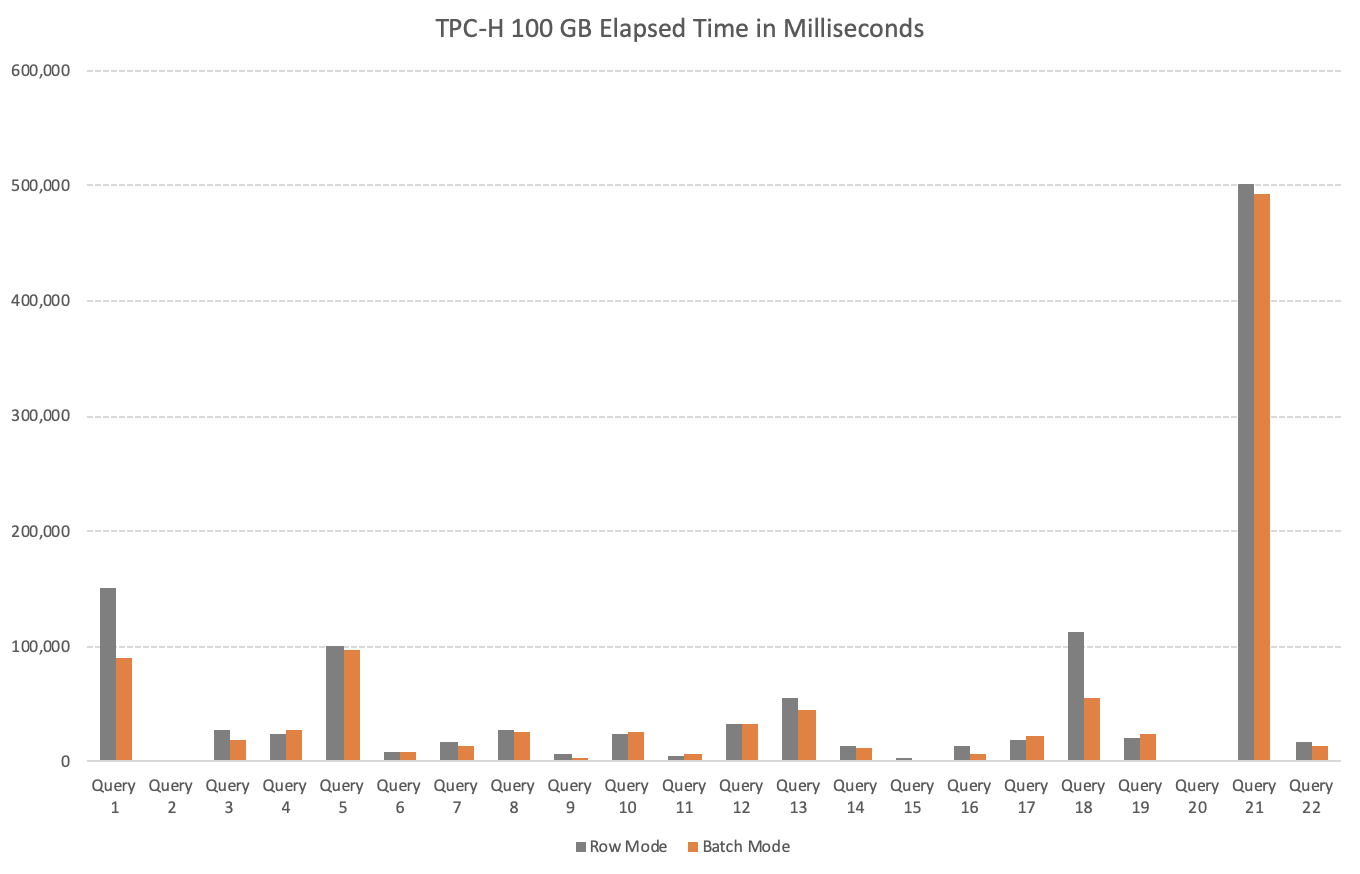
The overall trend is again very very positive, with the queries 1, 3, 7, 9, 16 and 18 simply blowing the dust of the Row Execution Mode performances.
All queries have received Batch Execution Mode when attempted and the overall improvement was 16% which represented a win 161 seconds giving us over 2 and a half minutes of improvement from the original 1190 seconds.
On the negatives side, the percentage of the queries with the Batch Mode which have received a negative improvement for their performance has risen to 27,27% with the queries 4, 11, 17, 19 & 20 delivering the negative news. Notice the flip side that the queries 19 & 20 in fact went from not using the Batch Mode into the negative results - we shall need to dive into them in a bit.
The positive effect that should be noted and that has been quite a long time pain point was the query 21 and which is doing pretty much OK with positive performance.
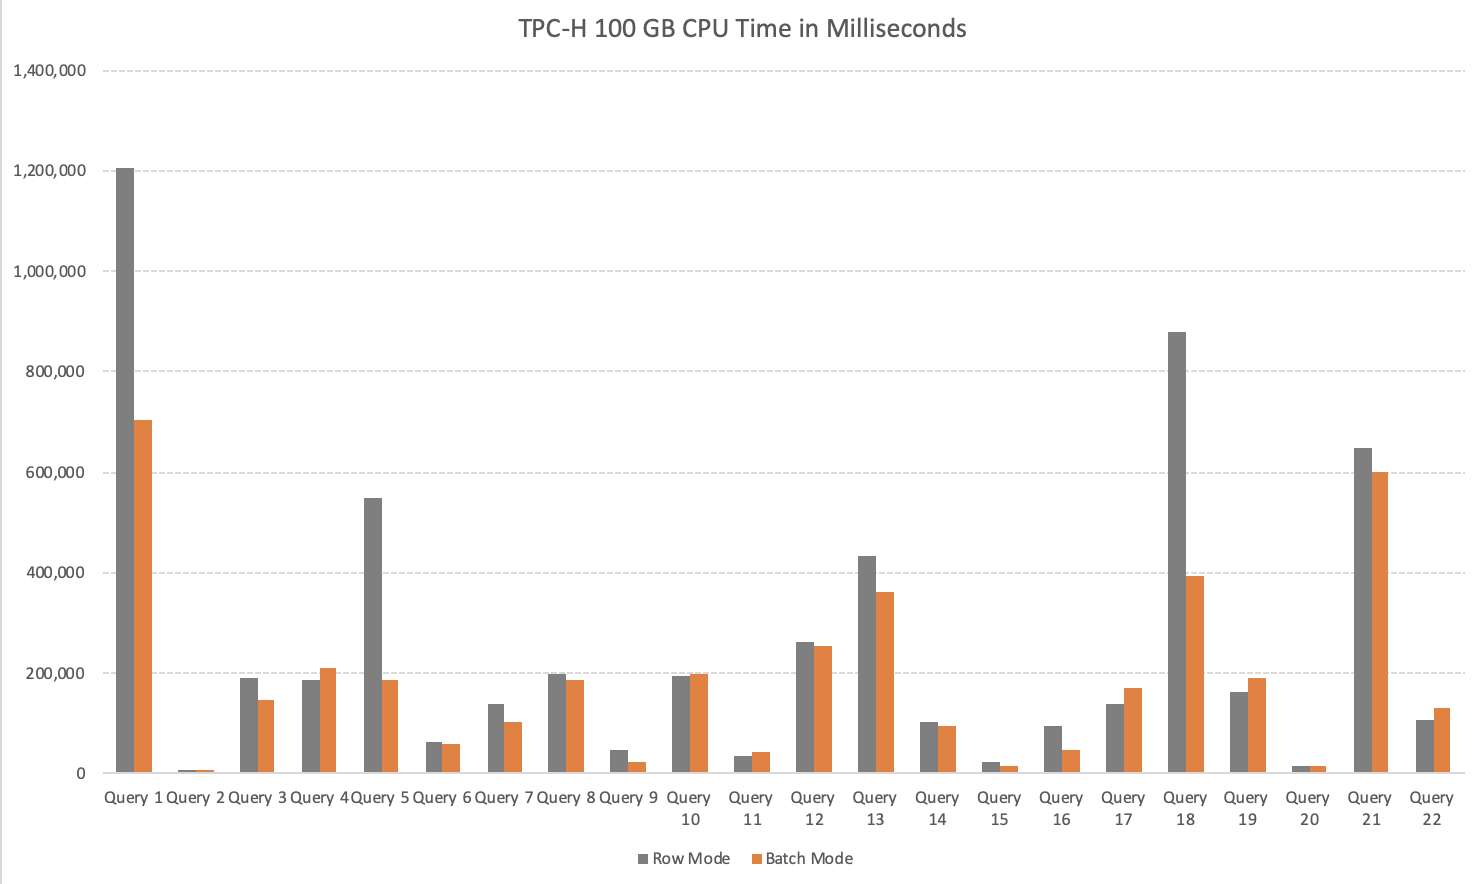
The CPU improvements on the image above are telling the story for themselves with massive 1541 seconds less time spent on CPU tasks - that is well over 25 of cumulative minutes less! This represents a great 37% of the total CPU work time.
The Raw Results
If you are interested in the raw results for the 100 GB TPC-H Database, here they are on the image below:
Those little husky details, part II
Query 19:
set statistics time,io on


SELECT SUM(L_EXTENDEDPRICE* (1 - L_DISCOUNT)) AS REVENUE
FROM LINEITEM, PART
WHERE (P_PARTKEY = L_PARTKEY AND P_BRAND = 'Brand#12' AND P_CONTAINER IN ('SM CASE', 'SM BOX', 'SM PACK', 'SM PKG') AND L_QUANTITY >= 1 AND L_QUANTITY <= 1 + 10 AND P_SIZE BETWEEN 1 AND 5
AND L_SHIPMODE IN ('AIR', 'AIR REG') AND L_SHIPINSTRUCT = 'DELIVER IN PERSON')
OR (P_PARTKEY = L_PARTKEY AND P_BRAND ='Brand#23' AND P_CONTAINER IN ('MED BAG', 'MED BOX', 'MED PKG', 'MED PACK') AND L_QUANTITY >=10 AND L_QUANTITY <=10 + 10 AND P_SIZE BETWEEN 1 AND 10
AND L_SHIPMODE IN ('AIR', 'AIR REG') AND L_SHIPINSTRUCT = 'DELIVER IN PERSON')
OR (P_PARTKEY = L_PARTKEY AND P_BRAND = 'Brand#34' AND P_CONTAINER IN ( 'LG CASE', 'LG BOX', 'LG PACK', 'LG PKG') AND L_QUANTITY >=20 AND L_QUANTITY <= 20 + 10 AND P_SIZE BETWEEN 1 AND 15
AND L_SHIPMODE IN ('AIR', 'AIR REG') AND L_SHIPINSTRUCT = 'DELIVER IN PERSON');


SELECT SUM(L_EXTENDEDPRICE* (1 - L_DISCOUNT)) AS REVENUE
FROM LINEITEM, PART
WHERE (P_PARTKEY = L_PARTKEY AND P_BRAND = 'Brand#12' AND P_CONTAINER IN ('SM CASE', 'SM BOX', 'SM PACK', 'SM PKG') AND L_QUANTITY >= 1 AND L_QUANTITY <= 1 + 10 AND P_SIZE BETWEEN 1 AND 5
AND L_SHIPMODE IN ('AIR', 'AIR REG') AND L_SHIPINSTRUCT = 'DELIVER IN PERSON')
OR (P_PARTKEY = L_PARTKEY AND P_BRAND ='Brand#23' AND P_CONTAINER IN ('MED BAG', 'MED BOX', 'MED PKG', 'MED PACK') AND L_QUANTITY >=10 AND L_QUANTITY <=10 + 10 AND P_SIZE BETWEEN 1 AND 10
AND L_SHIPMODE IN ('AIR', 'AIR REG') AND L_SHIPINSTRUCT = 'DELIVER IN PERSON')
OR (P_PARTKEY = L_PARTKEY AND P_BRAND = 'Brand#34' AND P_CONTAINER IN ( 'LG CASE', 'LG BOX', 'LG PACK', 'LG PKG') AND L_QUANTITY >=20 AND L_QUANTITY <= 20 + 10 AND P_SIZE BETWEEN 1 AND 15
AND L_SHIPMODE IN ('AIR', 'AIR REG') AND L_SHIPINSTRUCT = 'DELIVER IN PERSON')
OPTION (USE HINT('DISALLOW_BATCH_MODE'));
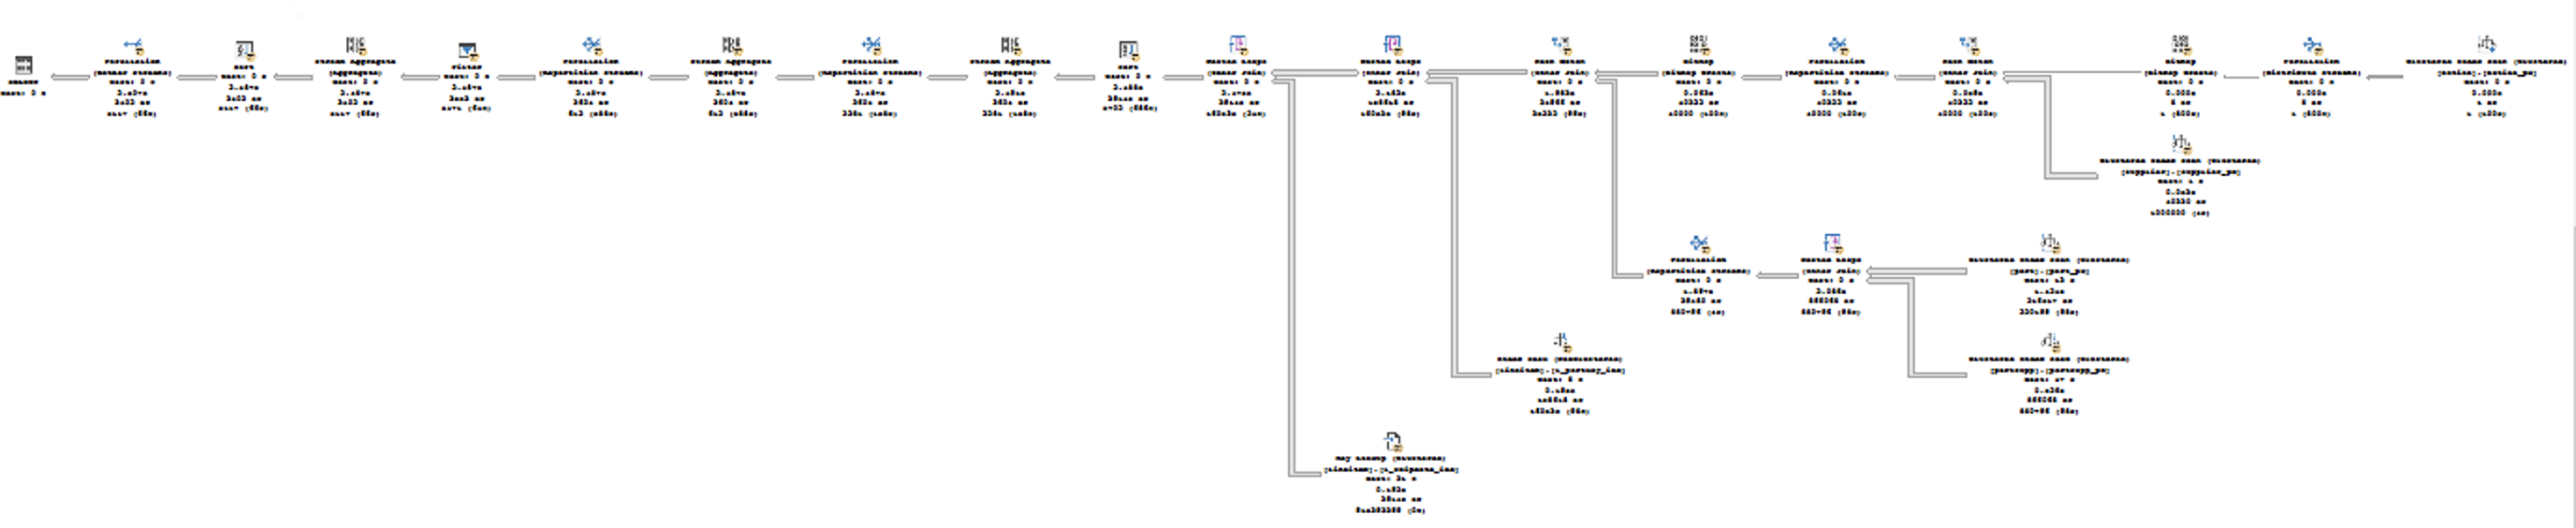
This time we have good amount of data and we are getting Batch Execution Mode where it is supposed to be, and the both execution plans are available below:
The same problem as in many other places strikes, the OFF-ROW predicate filtering which result is quite visible on the execution plan with the same Nonclustered Index Scan on the LINEITEM table takes 21 seconds for the Batch Execution Mode and 19 Seconds for the Row Execution Mode. The effectiveness of the IN-ROW processing trumps the Batch Mode in this case and other operators do not have an opportunity to fix the problem, since the queries are not astonishingly complex and there are no complex Grouping, Distinct or Sorting operators.

Query 19 TPCH 100 Batch Mode Lineitem Predicate
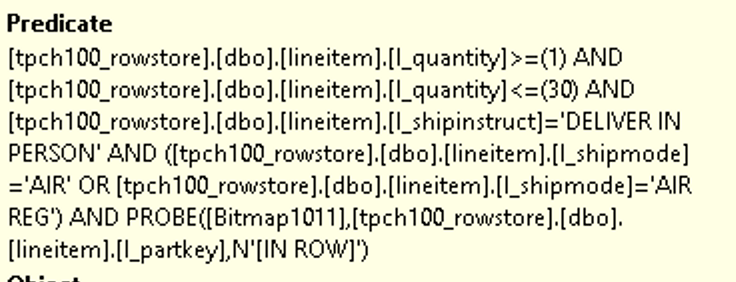
Query 19 TPCH 100 Row Mode Lineitem Predicate
Query 20:
The query 20 tackles much smaller problem than some of the bigger queries against the TPC-H 100 GB Database do with much smaller execution times (and that's why it would not trigger the Batch Execution Mode) at all for the TPC-H 10 GB Database:
set statistics time,io on

SELECT S_NAME, S_ADDRESS FROM SUPPLIER, NATION
WHERE S_SUPPKEY IN (SELECT PS_SUPPKEY FROM PARTSUPP
 WHERE PS_PARTKEY in (SELECT P_PARTKEY FROM PART WHERE P_NAME like 'forest%%') AND
 PS_AVAILQTY > (SELECT 0.5*sum(L_QUANTITY) FROM LINEITEM WHERE L_PARTKEY = PS_PARTKEY AND
  L_SUPPKEY = PS_SUPPKEY AND L_SHIPDATE >= '1994-01-01' AND
  L_SHIPDATE < dateadd(yy,1,'1994-01-01'))) AND S_NATIONKEY = N_NATIONKEY AND N_NAME = 'CANADA'
ORDER BY S_NAME;

SELECT S_NAME, S_ADDRESS FROM SUPPLIER, NATION
WHERE S_SUPPKEY IN (SELECT PS_SUPPKEY FROM PARTSUPP
 WHERE PS_PARTKEY in (SELECT P_PARTKEY FROM PART WHERE P_NAME like 'forest%%') AND
 PS_AVAILQTY > (SELECT 0.5*sum(L_QUANTITY) FROM LINEITEM WHERE L_PARTKEY = PS_PARTKEY AND
  L_SUPPKEY = PS_SUPPKEY AND L_SHIPDATE >= '1994-01-01' AND
  L_SHIPDATE < dateadd(yy,1,'1994-01-01'))) AND S_NATIONKEY = N_NATIONKEY AND N_NAME = 'CANADA'
ORDER BY S_NAME
OPTION (USE HINT('DISALLOW_BATCH_MODE'));
The execution plans looks a little bit different with a quite interesting detail that I can mark as a general observation for Batch Execution Mode usage is that the Adaptive Index Joins are much more frequent to be found. I guess it is also a kind of a safety mechanism for the first release of the Batch Mode on Rowstore Indexes just in the case something goes wrong.
The usual suspect & usual "criminal" are the IN-ROW and OFF-ROW processing on the biggest table SUPPLIER with 1 Million Rows, that we have seen before:
Query 20 Batch Execution Mode Tablle Supplier Predicate

Query 20 Row Execution Mode Table Supplier Predicate
The details are very clear and should give no doubt.
One tricky thing
There is one incredibly tricky detail when you consider the cost of the query is around the tipping point (Threshold for parallelsm) -> some of the Row Execution Mode queries will cost typically more than the logical equivalent cost for the queries using the Batch Execution Mode, which will force the execution to be run in single-threaded fashion, while the Row Execution Mode will still have the advantages of the multiple cores.
This will be prevalent on the smaller databases, such as 10 GB version of the TPC-H that I have used for the tests.
The Final Thoughts
It is undeniable that Batch Mode can do wonders for the queries, and in some cases the doubling of the performance takes place (Queries 16 & 18 for the TPC-H 100 GB), which is simply amazing if you think that a version upgrade can give you this without major downsides for those type of queries.
10 GB Version of the TPC-H gave in total the amazing 39% improvement, while scaling the source 10 times to the 100 GB gave us just 19% of the improvement. Still incredible, do not get me wrong, but scaling up allowed some queries to expose their frailties and overall I feel happy.
The more complex queries with aggregations and bigger tables (10s, 100s & 1000s of millions of rows) will tend to bring together more advantages to the Batch Execution Mode.
I will confess that over a period that I am testing the results, I have seen better results in February of 2019 then right now (August 2019) and I keep on hoping that some things might improve, even though I guess that most people agree that we are on the final line for the Sql Server 2019 launch and that right now the active development is about to be stopped and only the bug-fixing activities will take place.
I am happy about the results and while not that happy as I was hoping to be, I know there is an incredible amount of effort to make things work and this is the first release of the Batch Mode on the Rowstore Indexes.
If you want to be sure which results you will be getting, then you will need to test your database before upgrading. Consider the type of queries and see if the bitmap filters will get you in trouble.
If your tests are showing you that you are in trouble, look to mitigate the situation by using one of the available knobs, such as query hints & database scoped configurations to control the potential negative impact. You have the tools.
For me, I am anxiously waiting for having the Batch Execution Mode on Azure SQL Database and with the upcoming Sql Server 2019 - I am sure we shall be hearing some amazing stories about the miraculous improvements.
to be continued ...
Hey Niko,
I am curious about what kind of hardware/VM you ran these tests on?
Glenn, in his post: “For the purposes of tests I have chosen an Azure VM with 8-core CPU with 64GB of RAM and an extra 1 TB drive.”. I didn’t see exactly which spec machine he provisioned though.
Hi Glenn,
the VM is a Standard E8s v3 (8 vcpus, 64 GiB memory) with 1 TB of the unmanaged Premium SSD disk.
I will update the article to reflect it.
Best regards,
Niko Neugebauer
Nice report Niko! I would be interested to hear the CPU details and cumulative wait states during the query runs. What were the queries waiting on? If the CPUs were jammed up, I would love to see a repeat without compression to see the effect of that.
Hi Kevin,
great idea – will do a research and publish some update on this topic.
I have had a great conversation with the QP team on this matter last year (and actually it was Vassilis who noticed that our comparison of test results was really huge), and I remember that the results indeed get much greater with no compression – but as I mentioned in the post, I consider that no compression for DWH is a tough and expensive strategy (which can be activated under certain conditions, like ETL times). In the real world since Sql Server 2016 SP1 I do not see much people not using compression.
From the fast look on the wait results – the CXPACKET & HTª (BUILD, REPARTITION, DELETE, etc) were the biggest consumers.
Best regards,
Niko Neugebauer