Continuation from the previous 104 parts, the whole series can be found at https://www.nikoport.com/columnstore/.
For a very long time I was intending to write some of the unsung & almost hidden improvements of the SQL Server 2016 – the performance counters. To my knowledge, the only person mentioning them, even though very briefly, during presentations was Sunil Agarwal (Tiger Team, at that time he was the Program Manager for the Columnstore Indexes at Microsoft).
Great Lonny Niederstadt has defended for quite some time the usage of the performance counters in comparison to the DMV’s to soften the observation impact whenever possible and after Tuga IT 2017, I thought – I need to finish this blog post desperately, because way too few people are using/mentioning performance counters, while SQL Server 2017 is almost released – keep on writing about SQL Server is not exactly what I intend to do.
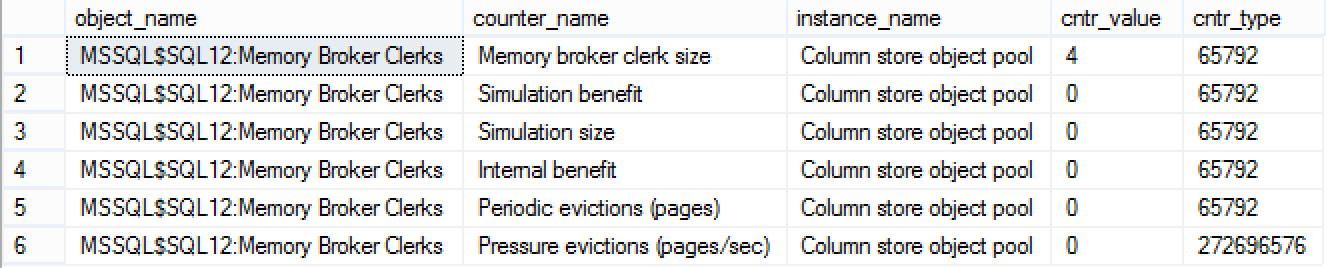 Since the initial release of the box version with the Columnstore Indexes (SQL Server 2012), there was always a need for getting some insights over the statistics of the Columnstore operations. Unfortunately the initial release was quite rushed and if you wanted to use Performance Counters with SQL Server 2012, you would be limited with just 6 counters that were focusing on the Columnstore Object Pool from the point of view of the Memory Broker clerk. Below you will find the full list of those 6 counters with a short description of what they do.
For monitoring Columnstore Object Pool size behaviour this is an incredibly valuable information, especially if you observe that your workloads starts to slow down because of the read disk access for the Columnstore Indexes, even though there is enough memory around.
Here are the performance counters that you can monitor for any SQL Server version, starting from SQL Server 2012:
Memory broker clerk size – the size of the Columnstore Object Pool
Simulation benefit – The value of memory to the clerk, in ms per page per ms, multiplied by 10 billion and truncated to an integer.
Simulation size – The current size of the clerk simulation, in pages.
Internal benefit – The internal value of memory for entry count pressure, in ms per page per ms, multiplied by 10 billion and truncated to an integer.
Periodic evictions (pages) – The number of pages evicted from the broker clerk by last periodic eviction.
Pressure evictions (pages/sec) – The number of pages per second evicted from the broker clerk by memory pressure.
For finding out the information on the available performance counters, I am using the following query, and if you are interested in experimenting on your test instances, feel free to use it:
select *
	from sys.dm_os_performance_counters
	where
		( object_name like '%Columnstore%' OR object_name like '%Column_store%'
		OR object_name like '%RowGroup%' OR object_name like '%Row Group%' OR object_name like '%Row_Group%'
		OR object_name like '%Delta%'
		OR object_name like '%Dictionary%'
		OR
		instance_name like '%Columnstore%' OR instance_name like '%Column_store%' OR instance_name like '%Column store%'
		OR instance_name like '%RowGroup%' OR instance_name like '%Row Group%' OR instance_name like '%Row_Group%'
		OR instance_name like '%Delta%'
		OR instance_name like '%Dictionary%'
		OR
		counter_name like '%Columnstore%' OR counter_name like '%Column_store%' OR counter_name like '%Column store%'
		OR counter_name like '%RowGroup%' OR counter_name like '%Row Group%' OR counter_name like '%Row_Group%'
		OR counter_name like '%Delta%'
		OR counter_name like '%Dictionary%' )
In SQL Server 2014 the number of performance counters, related to the Columnstore Indexes was improved from 6 to 14 with addition of 8 new counters that provided some basic information on the Row Groups locking.
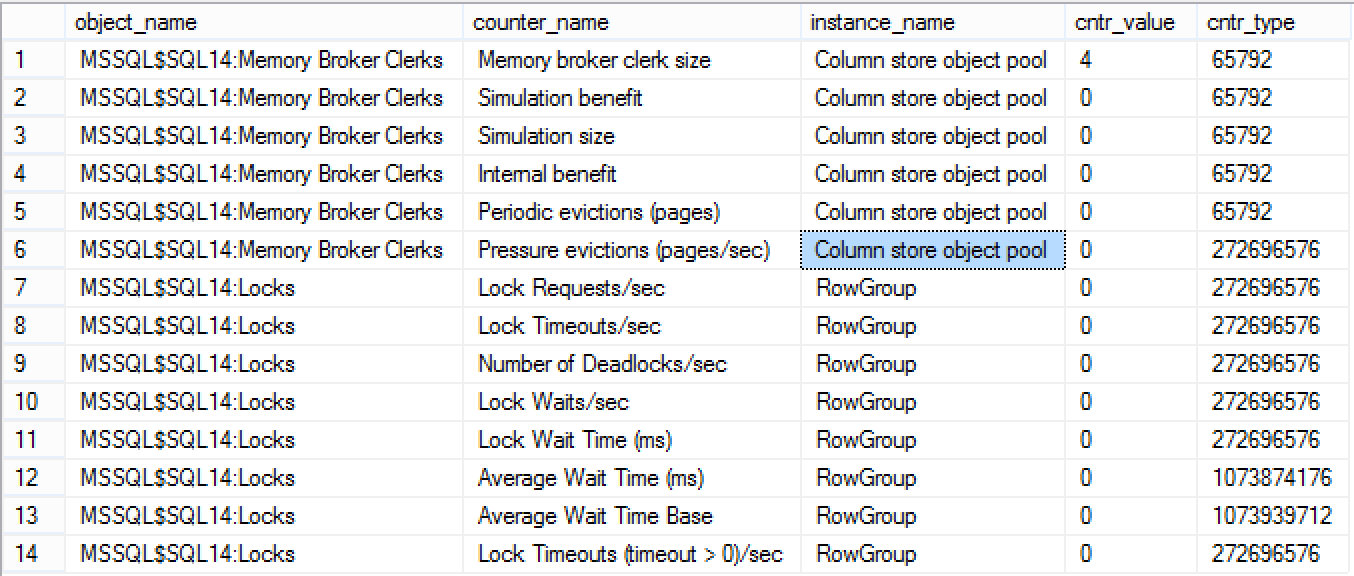 A new instance “RowGroup” was added to the MSSQL:Locks object providing information on the locking part of the Row Groups, and if you want to see how bad locking of the Row Groups was in SQL Server 2014, please consult the following article Clustered Columnstore Indexes – part 8 (“Locking”). Short resume: unless you are using Data Warehousing/Reporting in SQL Server 2014 with the Clustered Columnstore Indexes – avoid them at almost all cost.
Here is the complete list of the counters that were added in SQL Server 2014, and to the objectives of this blog post, I do not see any reason to describe any further this information:
Lock Requests/sec
Lock Timeouts/sec
Number of Deadlocks/sec
Lock Waits/sec
Lock Wait Time (ms)
Average Wait Time (ms)
Average Wait Time Base
Lock Timeouts (timeout > 0)/sec
As mentioned right in the beginning of this article, Sunil Agarwal lead the development team into adding greatly valuable performance counters with it’s own object ‘MSSQL:Columnstore‘ that provides some incredible insight on some of the internal operations that are not exposed in other ways.
This was a very much needed step, because SQL Server 2014 has brought a lot of different performance counters and objects for the In-Memory (XTP), while Columnstore Indexes were deserving a good treatment of their own.
Below you will see the screenshots of the different versions of SQL Server (2012, 2014 & 2016) and the visible new object name that is to be found for the counters:

SQL Server 2012 Perf Counters Objects
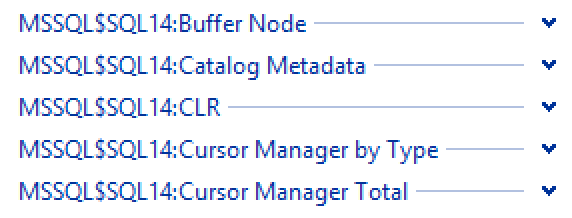
SQL Server 2014 Perf Counters Objects
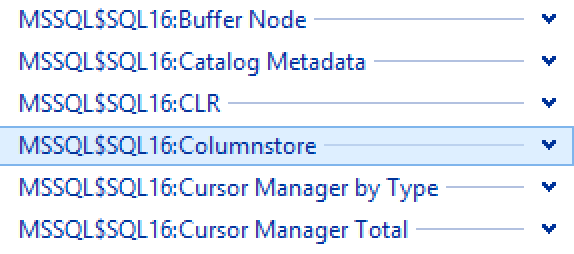
SQL Server 2016 Perf Counters Objects
The new counters for the SQL Server 2016 are listed below and they allowed to monitor Columnstore Indexes within SQL Server from the outside and with great inside, especially the Row Group operation insight I consider to be extremely valuable. All this counters are observable on the database or on the SQL Server instance level:
Delta Rowgroups Closed – Shows the number of the Delta-Stores that were closed by the engine and waiting for the Tuple Mover or manual operation to compress them.
Delta Rowgroups Compressed – This one shows the number of the Delta-Stores that were compressed into the Row Group. Notice that the Bulk Load API with amounts equal or superior 102.400 will not be accounted here, since no Delta-Stores are created in this scenario and the data is directly compressed into the Row Groups.
Delta Rowgroups Created – Shows the number of the Delta-Stores created.
Segment Cache Hit Ratio – Ratio for finding the Segment within Columnstore Object Pool.
Segment Cache Hit Ratio Base – The ratio is the total number of cache hits divided by the total number of cache lookups over the last few thousand page accesses.
Segment Reads/Sec – The number of Segments read per second. This might be a good indicator of the SQL Server Instance performance, even though the segments in their sizes can vary greatly. I consider that joining this information together with the amount of compressed data processed and the aggregate predicate pushdown as the base for the performance evaluation.
Total Delete Buffers Migrated – For OLTP scenarios, this information will provide the number of Deleted Buffers that were migrated into the Deleted Bitmap.
Total Merge Policy Evaluations – Merge Policy evaluation is an important indicator of the internal pressure between Row Groups to get merged. For mer information on the merging, please consult the following article Columnstore Indexes – part 74 (“Row Group Merging & Cleanup, SQL Server 2016 edition”):
Total Rowgroups Compressed – The total number of the Row Groups that were compressed. Incredibly valuable if you are constantly loading data and forcing incomplete Row Groups closure.
Total Rowgroups Fit For Merge – This counter will be increased when the counter Total Merge Policy Evaluations returns a positive result of the evaluation.
Total Rowgroups Merge Compressed – the number of compressed Row Groups during Merge operations.
Total Source Rowgroups Merged – the number of self-merged Row Groups.
Basic Test
Let’s make the simplest of the test for the performance counters by observing Delta Rowgroups Compressed. For this purpose let’s restore a fresh copy of the free test database ContosoRetailDW on the SQL Server 2016 SP1:
alter database ContosoRetailDW
    set SINGLE_USER WITH ROLLBACK IMMEDIATE;

RESTORE DATABASE [ContosoRetailDW]
    FROM  DISK = N'C:\Install\ContosoRetailDW.bak' WITH  FILE = 1,
        MOVE N'ContosoRetailDW2.0' TO N'C:\Data\ContosoRetailDW.mdf',
        MOVE N'ContosoRetailDW2.0_log' TO N'C:\Data\ContosoRetailDW.ldf',
        NOUNLOAD,  STATS = 5;

alter database ContosoRetailDW
    set MULTI_USER;
GO

GO
ALTER DATABASE [ContosoRetailDW] SET COMPATIBILITY_LEVEL = 130
GO
ALTER DATABASE [ContosoRetailDW] MODIFY FILE ( NAME = N'ContosoRetailDW2.0', SIZE = 2000000KB , FILEGROWTH = 128000KB )
GO
ALTER DATABASE [ContosoRetailDW] MODIFY FILE ( NAME = N'ContosoRetailDW2.0_log', SIZE = 400000KB , FILEGROWTH = 256000KB )
GO
Let’s create a trivial test table with 1 row and a Clustered Columnstore Index:
drop table if exists dbo.MaxDataTable;

create table dbo.MaxDataTable(
	c1 bigint,
	INDEX CC_MaxDataTable Clustered Columnstore,
);
 Let us set up the Performance Monitor by removing all currently added counters and add the
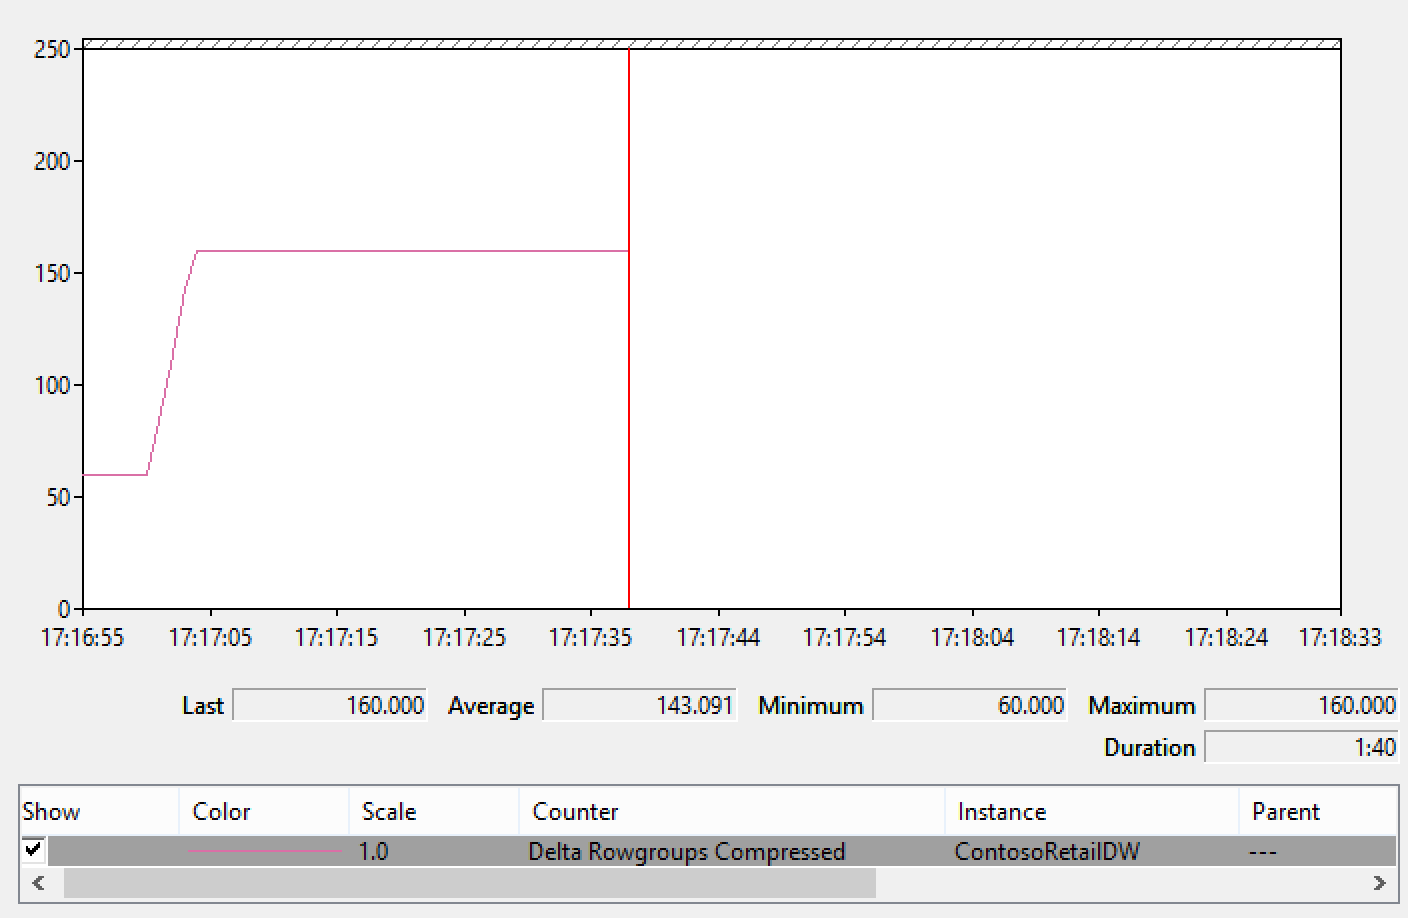
Delta Rowgroups Compressed counter. It will allow us to monitor the behaviour of our system and potential impact, because resource allocation for this operation are far from being trivial and there will be a blog post on this topic soon.
For the workload let’s run the following script which ads 10 rows to the test table, and then forcing it to close and compress. This script will be executed 100 times in SSMS:
declare @i as int;
declare @max as int;
select @max = isnull(max(C1),0) from dbo.MaxDataTable;
set @i = 1;

begin tran
while @i <= @max + 10
begin
	insert into dbo.MaxDataTable
		default values

	set @i = @i + 1;
end;
commit;

-- Forcing the  hint which forces the Delta Store to close open Row Groups
alter index CC_MaxDataTable on dbo.MaxDataTable
	REORGANIZE  with (COMPRESS_ALL_ROW_GROUPS = ON);
GO 100
You can see the results on the picture below that are better than any words:
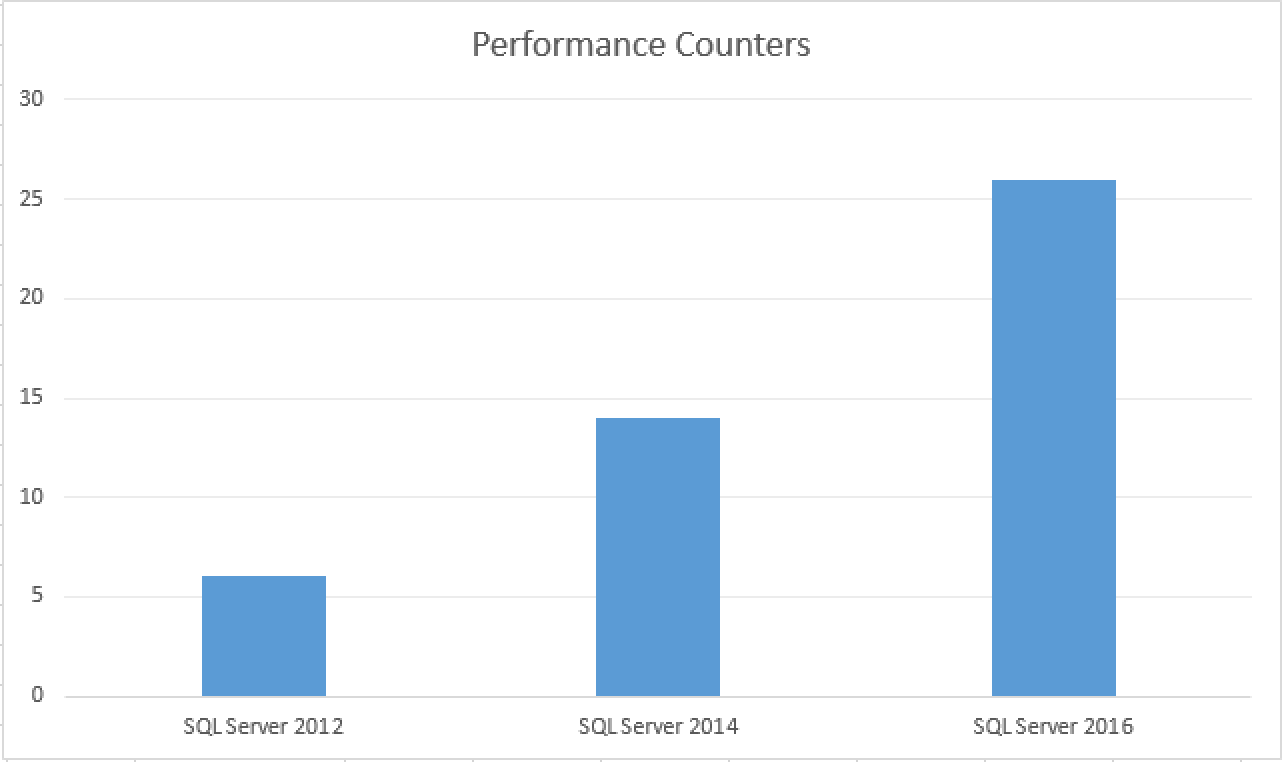
I love it when complex tasks become easy and performance counters are very important tools in the arsenal of someone trying to understand the behaviour of the monitored system, and I am glad that so far every single version of SQL Server increased the overall number of Performance Counters.
The overall evolution of the Performance Counters per SQL Server version can be observed on the picture below:
SQL Server 2017
The upcoming SQL Server 2017 might bring a couple of news, with new functionalities for Columnstore Indexes, such as LOB Support, Online Nonclustered Columnstore Index Rebuild,
I have checked on the new performance counters at the CTP 2.0 and there were none, but I have no doubt that overall there will be new items, especially with the port to Linux.
From my side, I would love to have some indications of the advanced functionalities being exposed as the counters, for example Aggregate Predicate Pushdowns or Columnstore Indexes scans being executed with Row Execution Mode. The Adaptive Query Processor deserves a couple of counters for sure.
I am not holding my breath and I do not consider those ones to be vital at the moment, but still would be nice to see some evolution within the product with a new version.
to be continued with Columnstore Indexes – part 106 (“Memory Requirements for Rebuild & Reorganize”)
Please elaborate more about these 3 . Will be very helpful.
Simulation benefit – The value of memory to the clerk, in ms per page per ms, multiplied by 10 billion and truncated to an integer.
Simulation size – The current size of the clerk simulation, in pages.
Internal benefit – The internal value of memory for entry count pressure, in ms per page per ms, multiplied by 10 billion and truncated to an integer.
Regards
Hi BhavyaArora,
for details on the memory clerks you can take a look here:
https://blogs.msdn.microsoft.com/sqljourney/2012/12/16/an-in-depth-look-at-sql-server-memorypart-1/
As for the 3 items mentioned, they are useful internally for determining the amount of memory that will be allocated for the respective Cache Store. This is how SQL Server decides what and how much to keep in the memory.
Best regards,
Niko
Great article on columnstore related perfmon counters. Are you aware of anyway (besides XE) of detecting via perfmon or dmv deltastore/open row group access? I would like to be able to detect the scenario where deltastores are being read excessively, if they are I can issue a REORG to compress the group. Example a 900,000 row group being left open and scanned 10,000 times hourly would be suboptimal. It appears that dm_db_column_store_row_group_operational_stats does not track scan_count for open row groups :-(
Never mind :-) I found dm_db_column_store_row_group_operational_stats actually does track this (the counters weren’t increasing how I expected). I suppose if there was a “delta store access” perfmon counter it probably wouldn’t be too useful by itself as you’d need to have an idea of the number of rows it contains to verify whether it’s an issue.
Hi Rob,
glad to hear that you found the solution fast.
Best regards,
Niko