 PASS Business Analytics Conference is not a new kid on the block anymore – happening for the second year in a row, this conference is targeting Business Analysts as well as the Business Intelligence specialists trying to take a look at the other side of the fence of Analytics.
Last year (2013) I was lucky to attend the very first conference that was in Chicago and I was very positively surprised by the direction, and knowing that it is not easy to organise a new type of a conference (especially for an established & very much credited organisation), I really applaud the drive and the will of PASS.
In my opinion and experience, this year (2014) the audience was different to the year before – there were less #SQLFamily and more unknown people, which to me looked more like Analysts. It felt different in this sense but from the other view this is a new space where new people should create a new community, so it is going into the right direction.
The conference rooms & spaces were much bigger compared to the 2013 Conference so at first I felt a kind of a lost. It has definitely had a lot todo with a good habit of staying in Seattle for the PASS Conference, were spaces are already known. :)
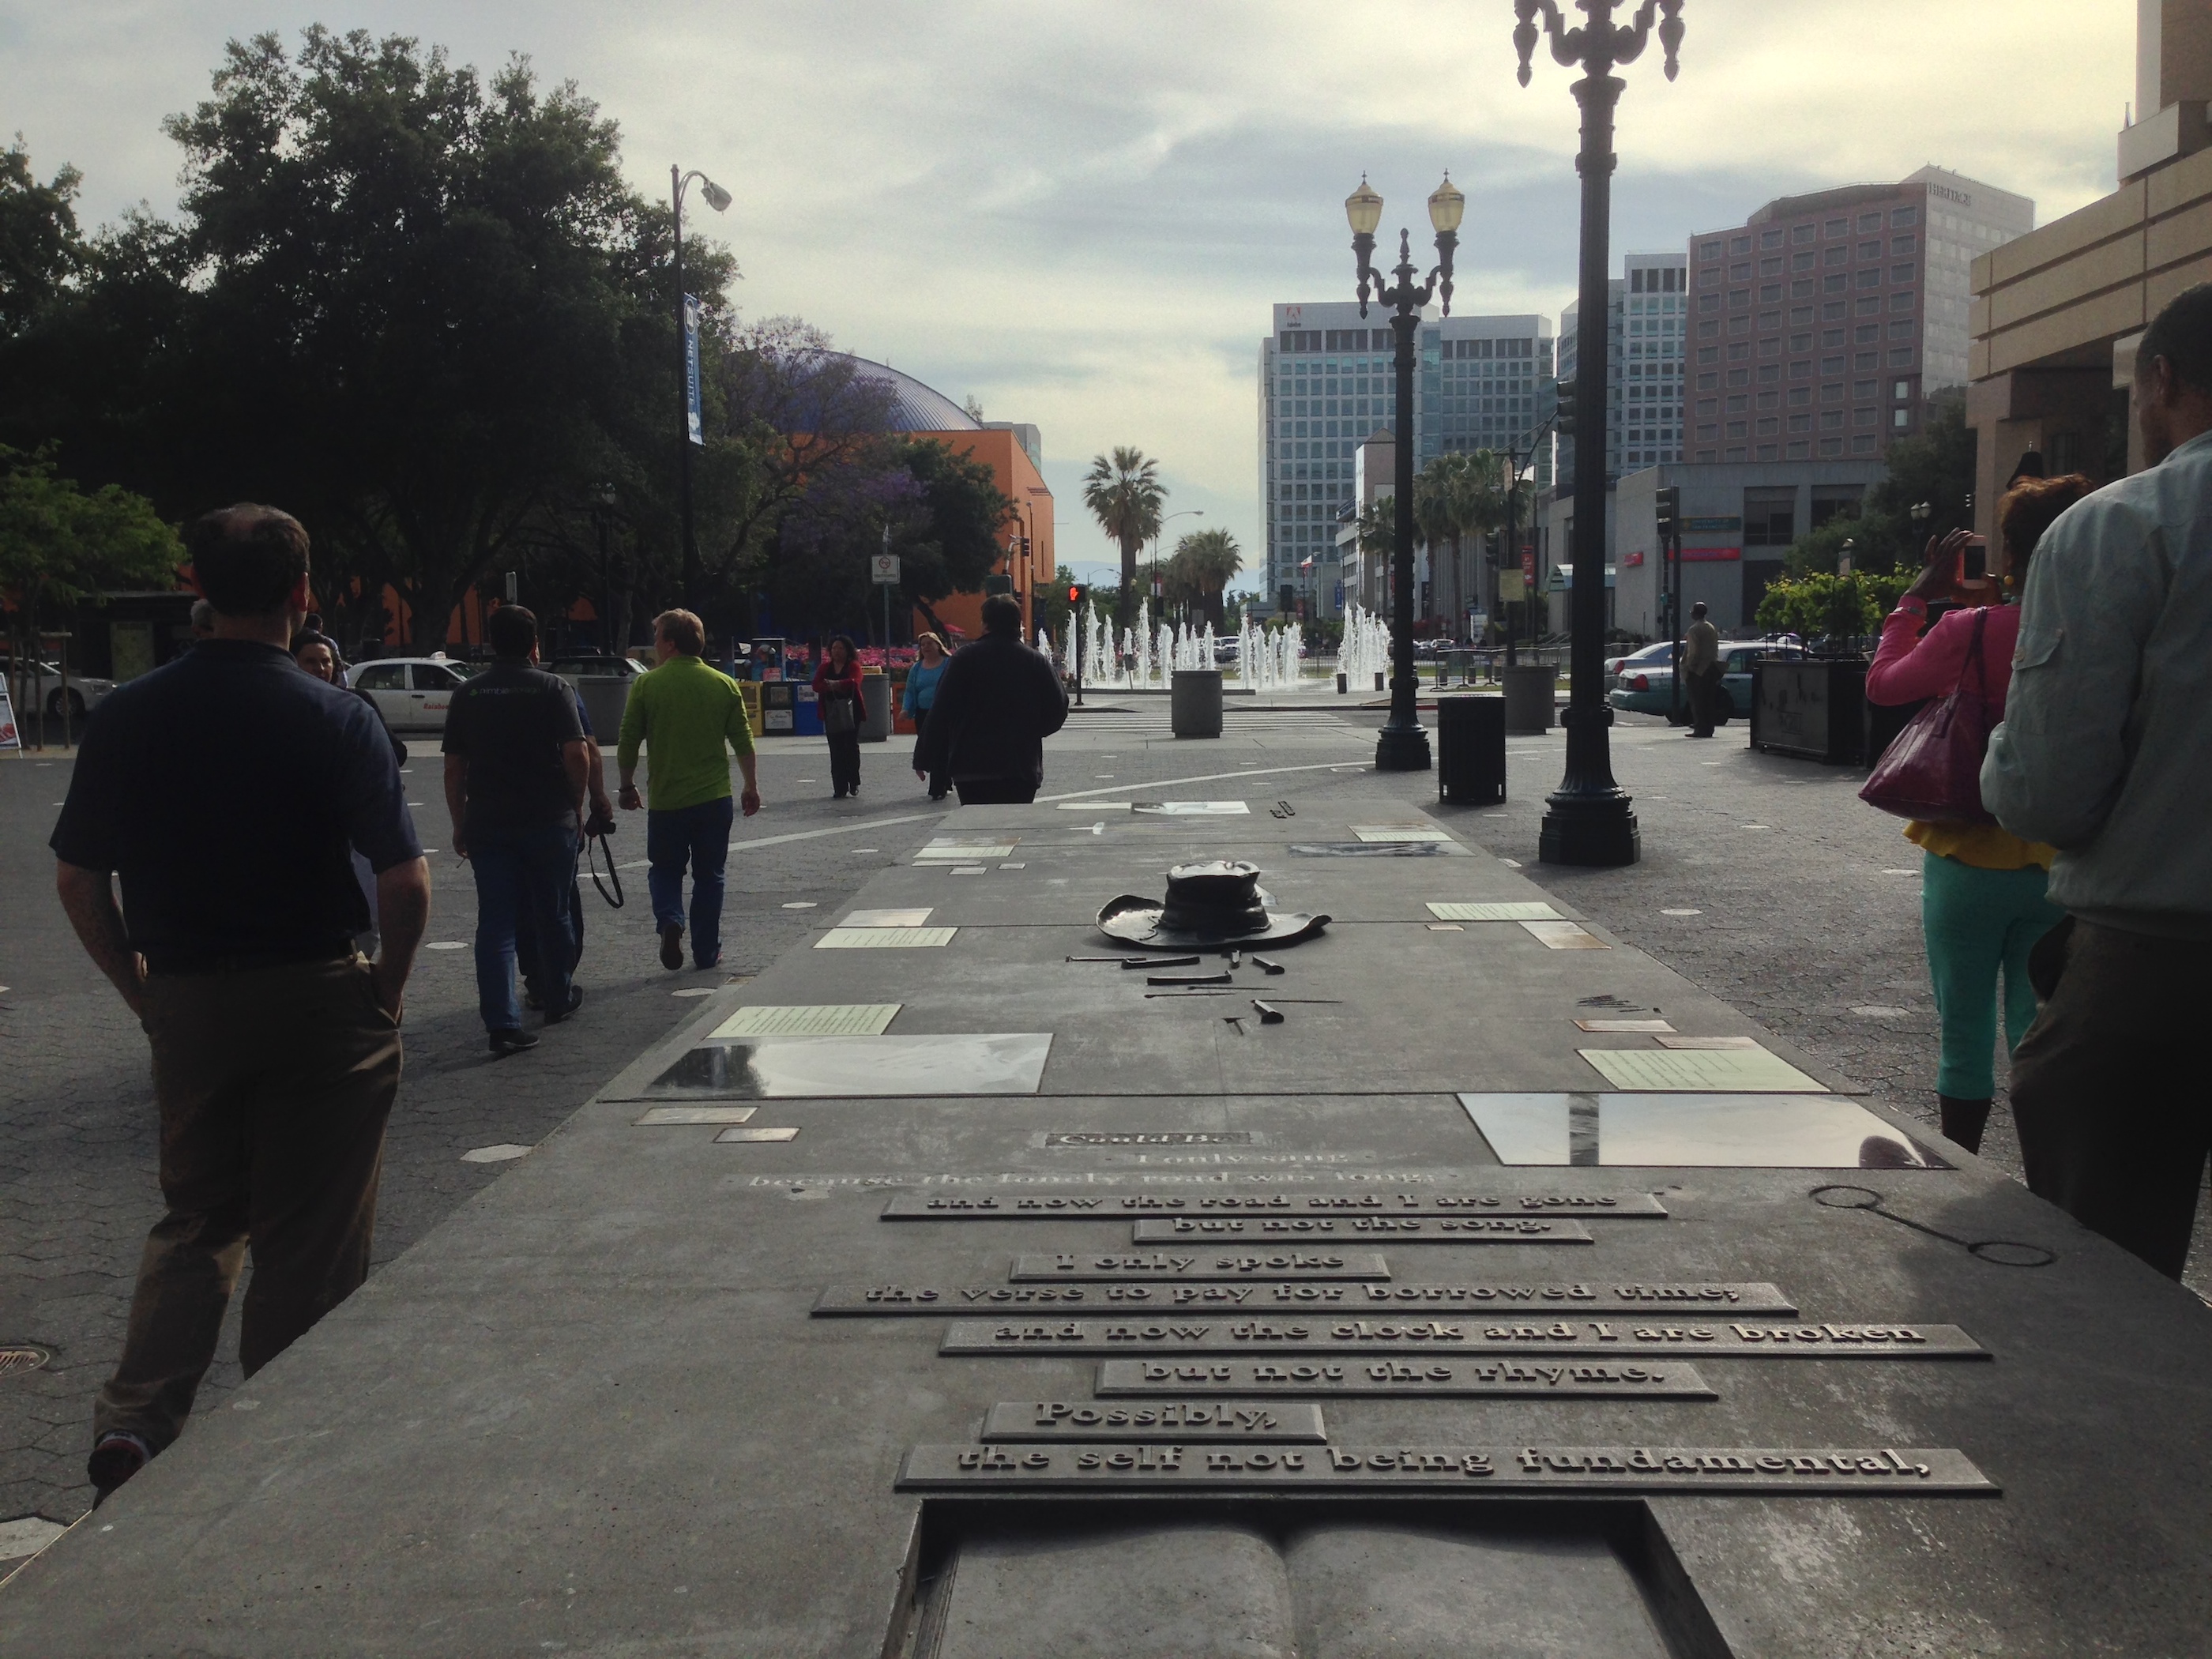 This year (2014) PASS Business Analytics Conference was held in San José (California), which is the right place for any type of such conferences – Silicon Valley is the place to be for any IT Conference or Startup.
The location itself was amazing and one of the suggested Hotels (The Fairmont) actually hosted the President of the United States at the same days as the conference, which naturally made any attempts to get into the hotels to be an airport security type of experience. :)
 Having spent a couple of days at the Yosemite National Parque with my colleagues and friends from OH22 I have arrived to San Jose on Wednesday and could not attend any of the Precons and so for me the conference kicked of on Thursday morning.
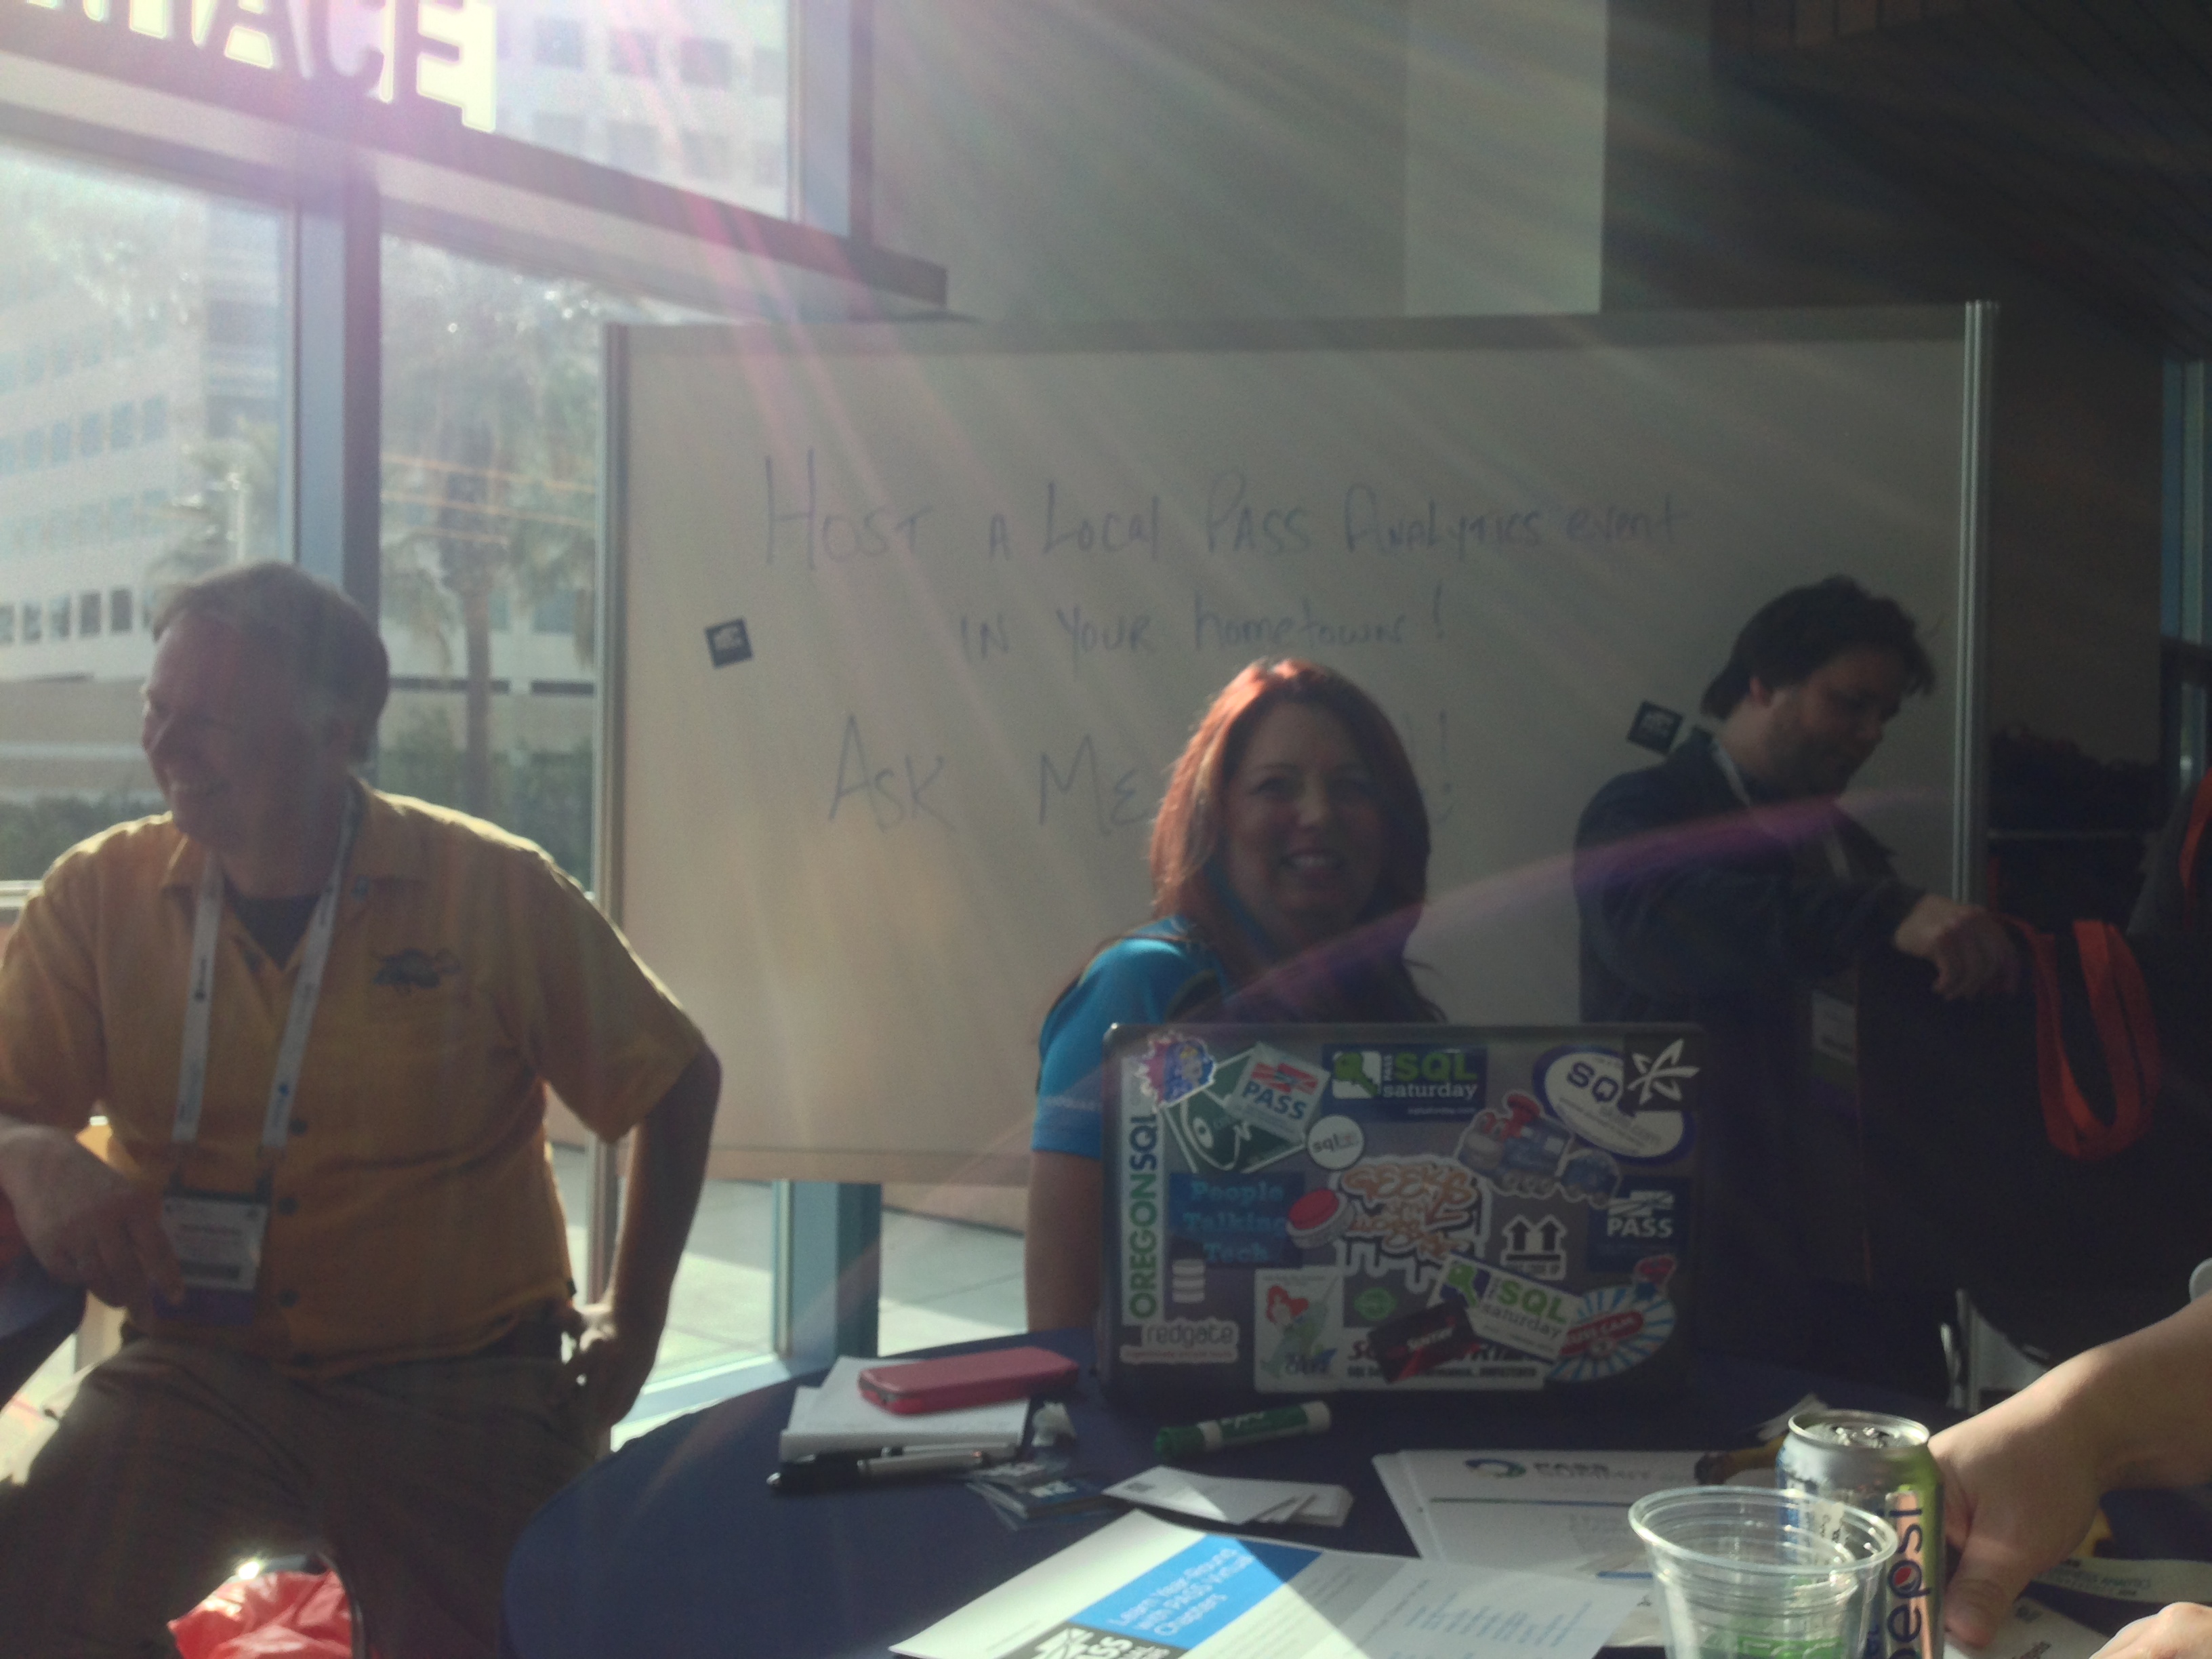
I did managed to do the registration on Wednesday evening and visited my friends from PASS at the Community Zone with Karla Landrum running the show as always.
Having arrived to the San José Conference Center around 7 AM, I picked up a quick breakfast getting to know a couple of new people and ran to the breakfast session delivered by Matt Mason and Theresa Palmer. It was a very similar session to the one they have delivered for the PASS DW/BI Virtual Chapter a couple of months ago.
 I could not stay very long time since I was one of the people invited to the blogger table for the Keynotes. It was a very big honour for me and so I was trying to make the best of it by twitting about the content delivered during the keynotes.
I can honestly say the the blogger table is simply too much fun – amazingly intelligent and funny people sitting near me with Kevin from PASS directing the twitter feeds very discreetly.
The keynote speakers for the Business Analytics Conference 2014 were Amir Netz and Kamal Hathi for Thursday Morning and David McCandless for Friday. You can watch the recording for free here:
PASS BA Conference 2014 Day 1 Keynote,
PASS BA Conference 2014 Day 2 Keynote
First of all – every keynote were absolutely fun, containing some astonishing amounts of the information, which is not a trivial thing to do and quite honestly, I see that it will be extremely challenging for PASS to keep on this quality in the future to come.
Thursday Keynote
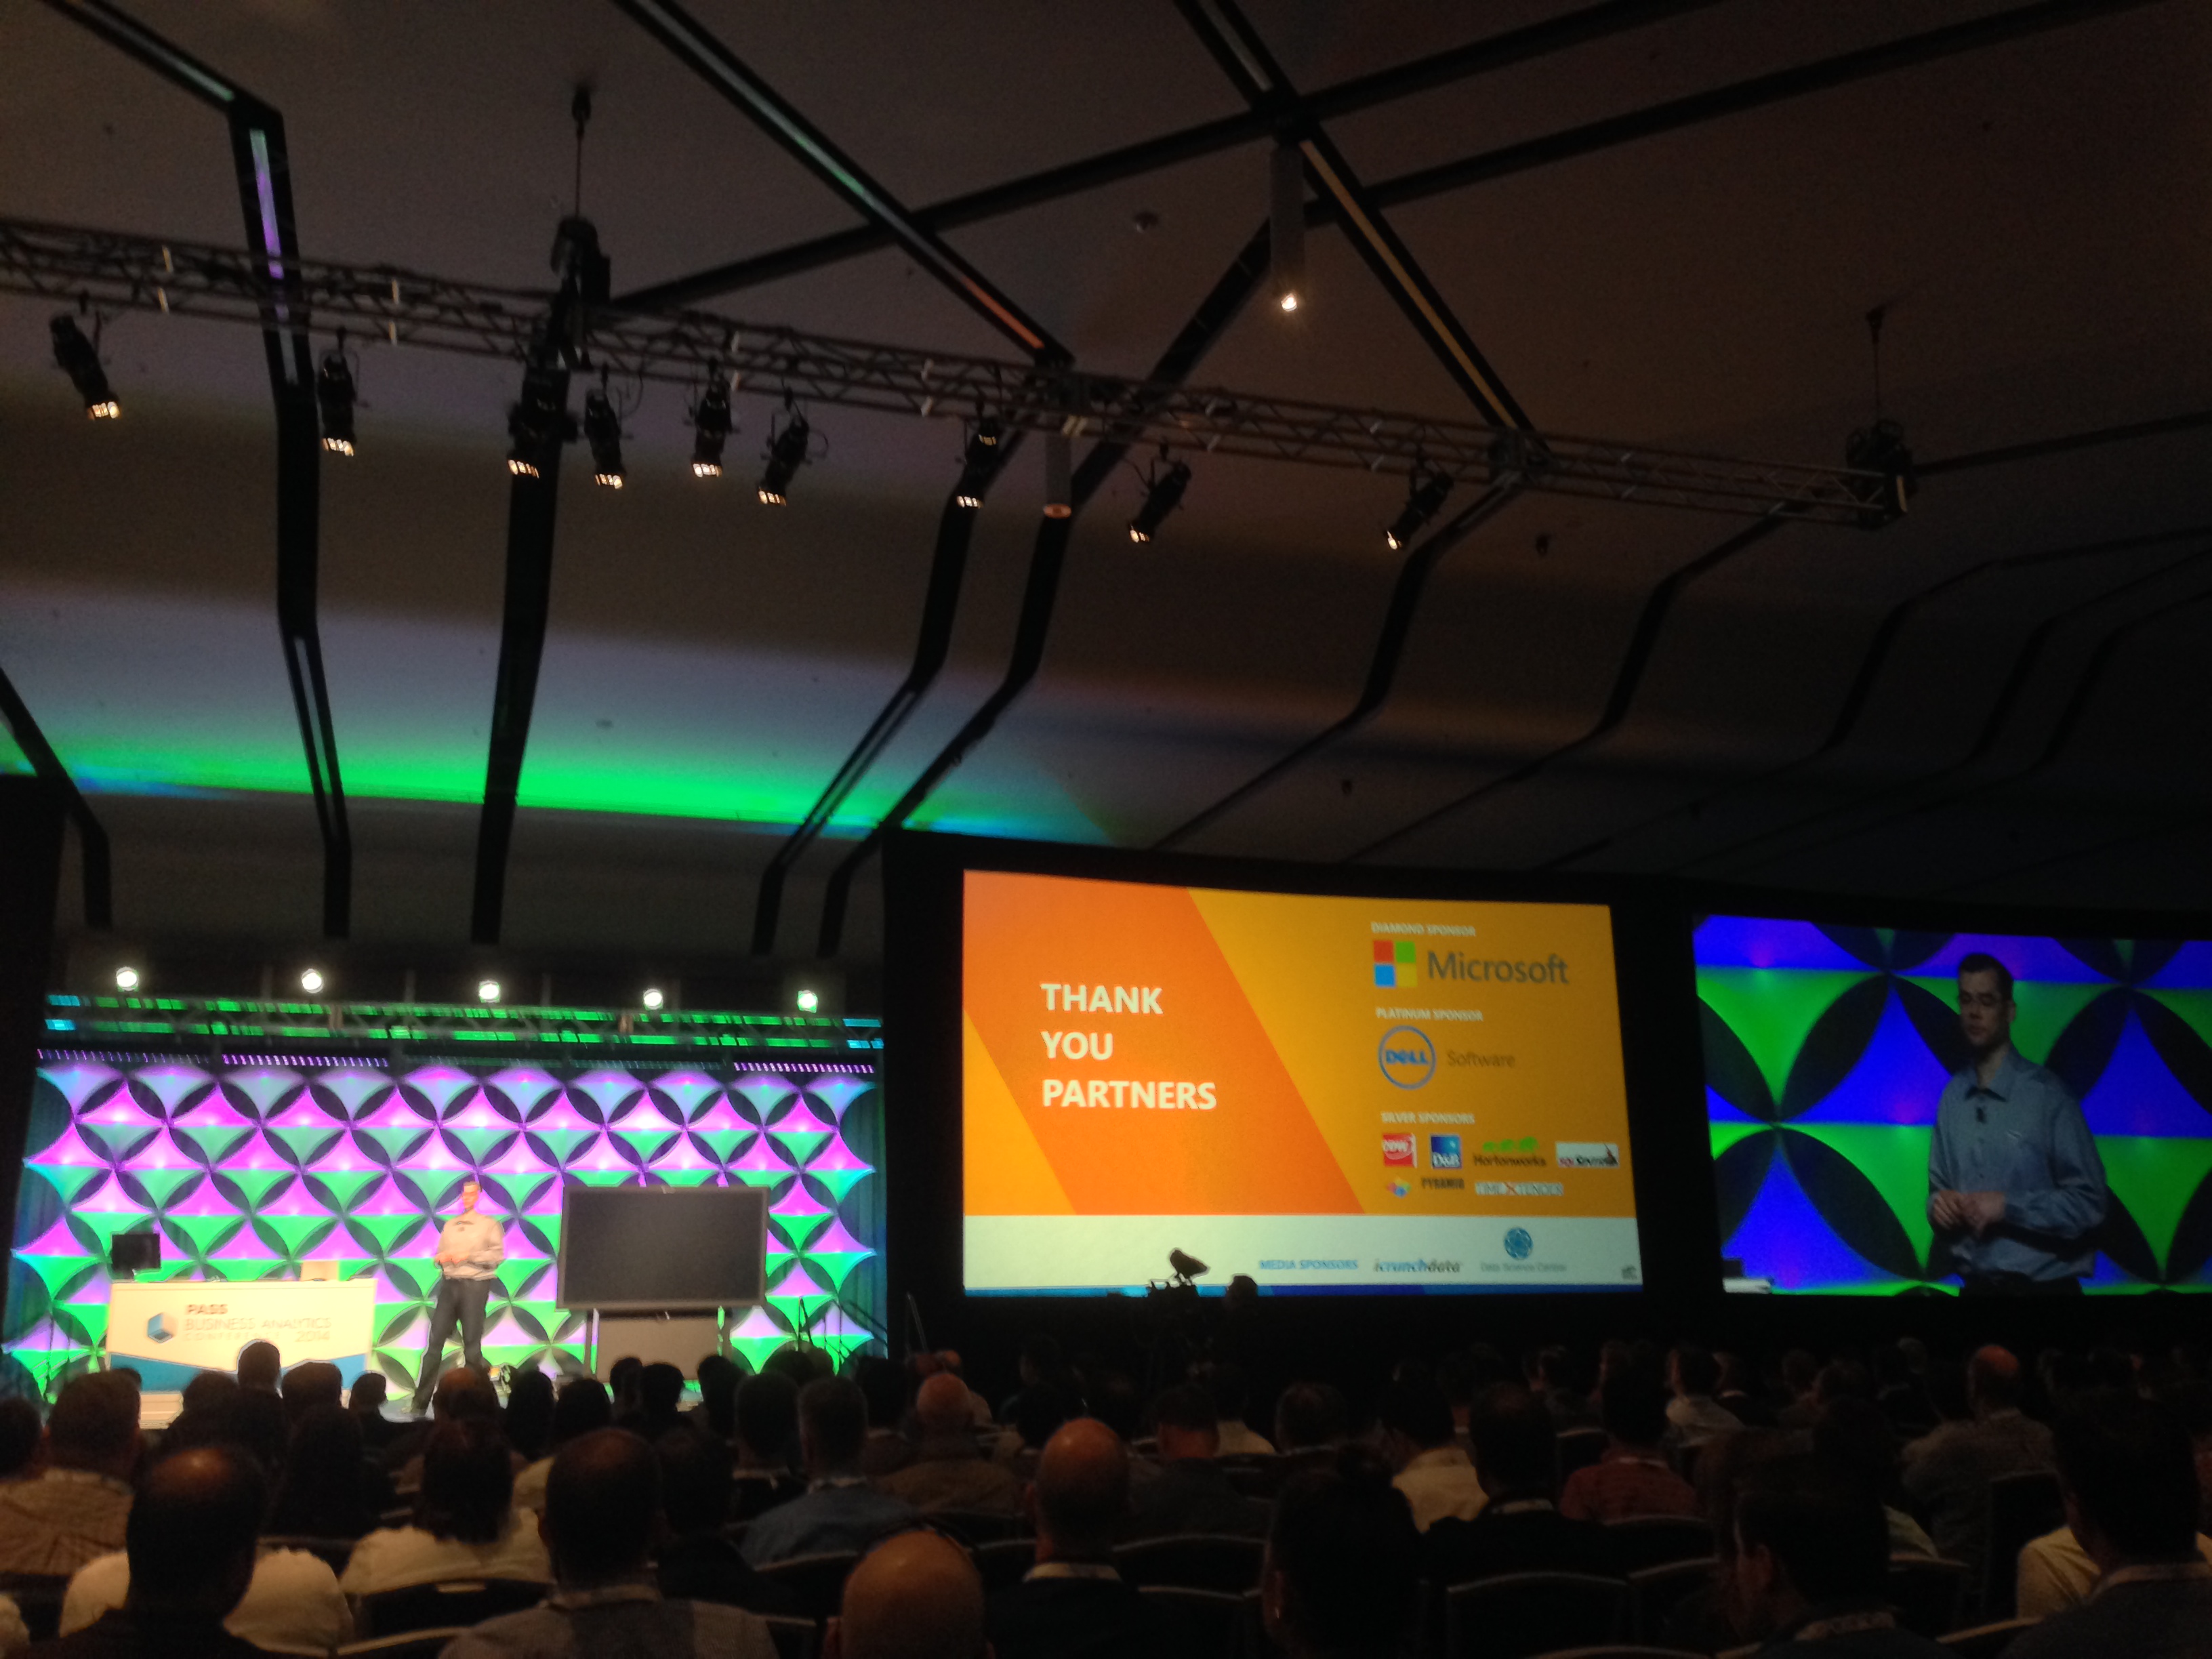
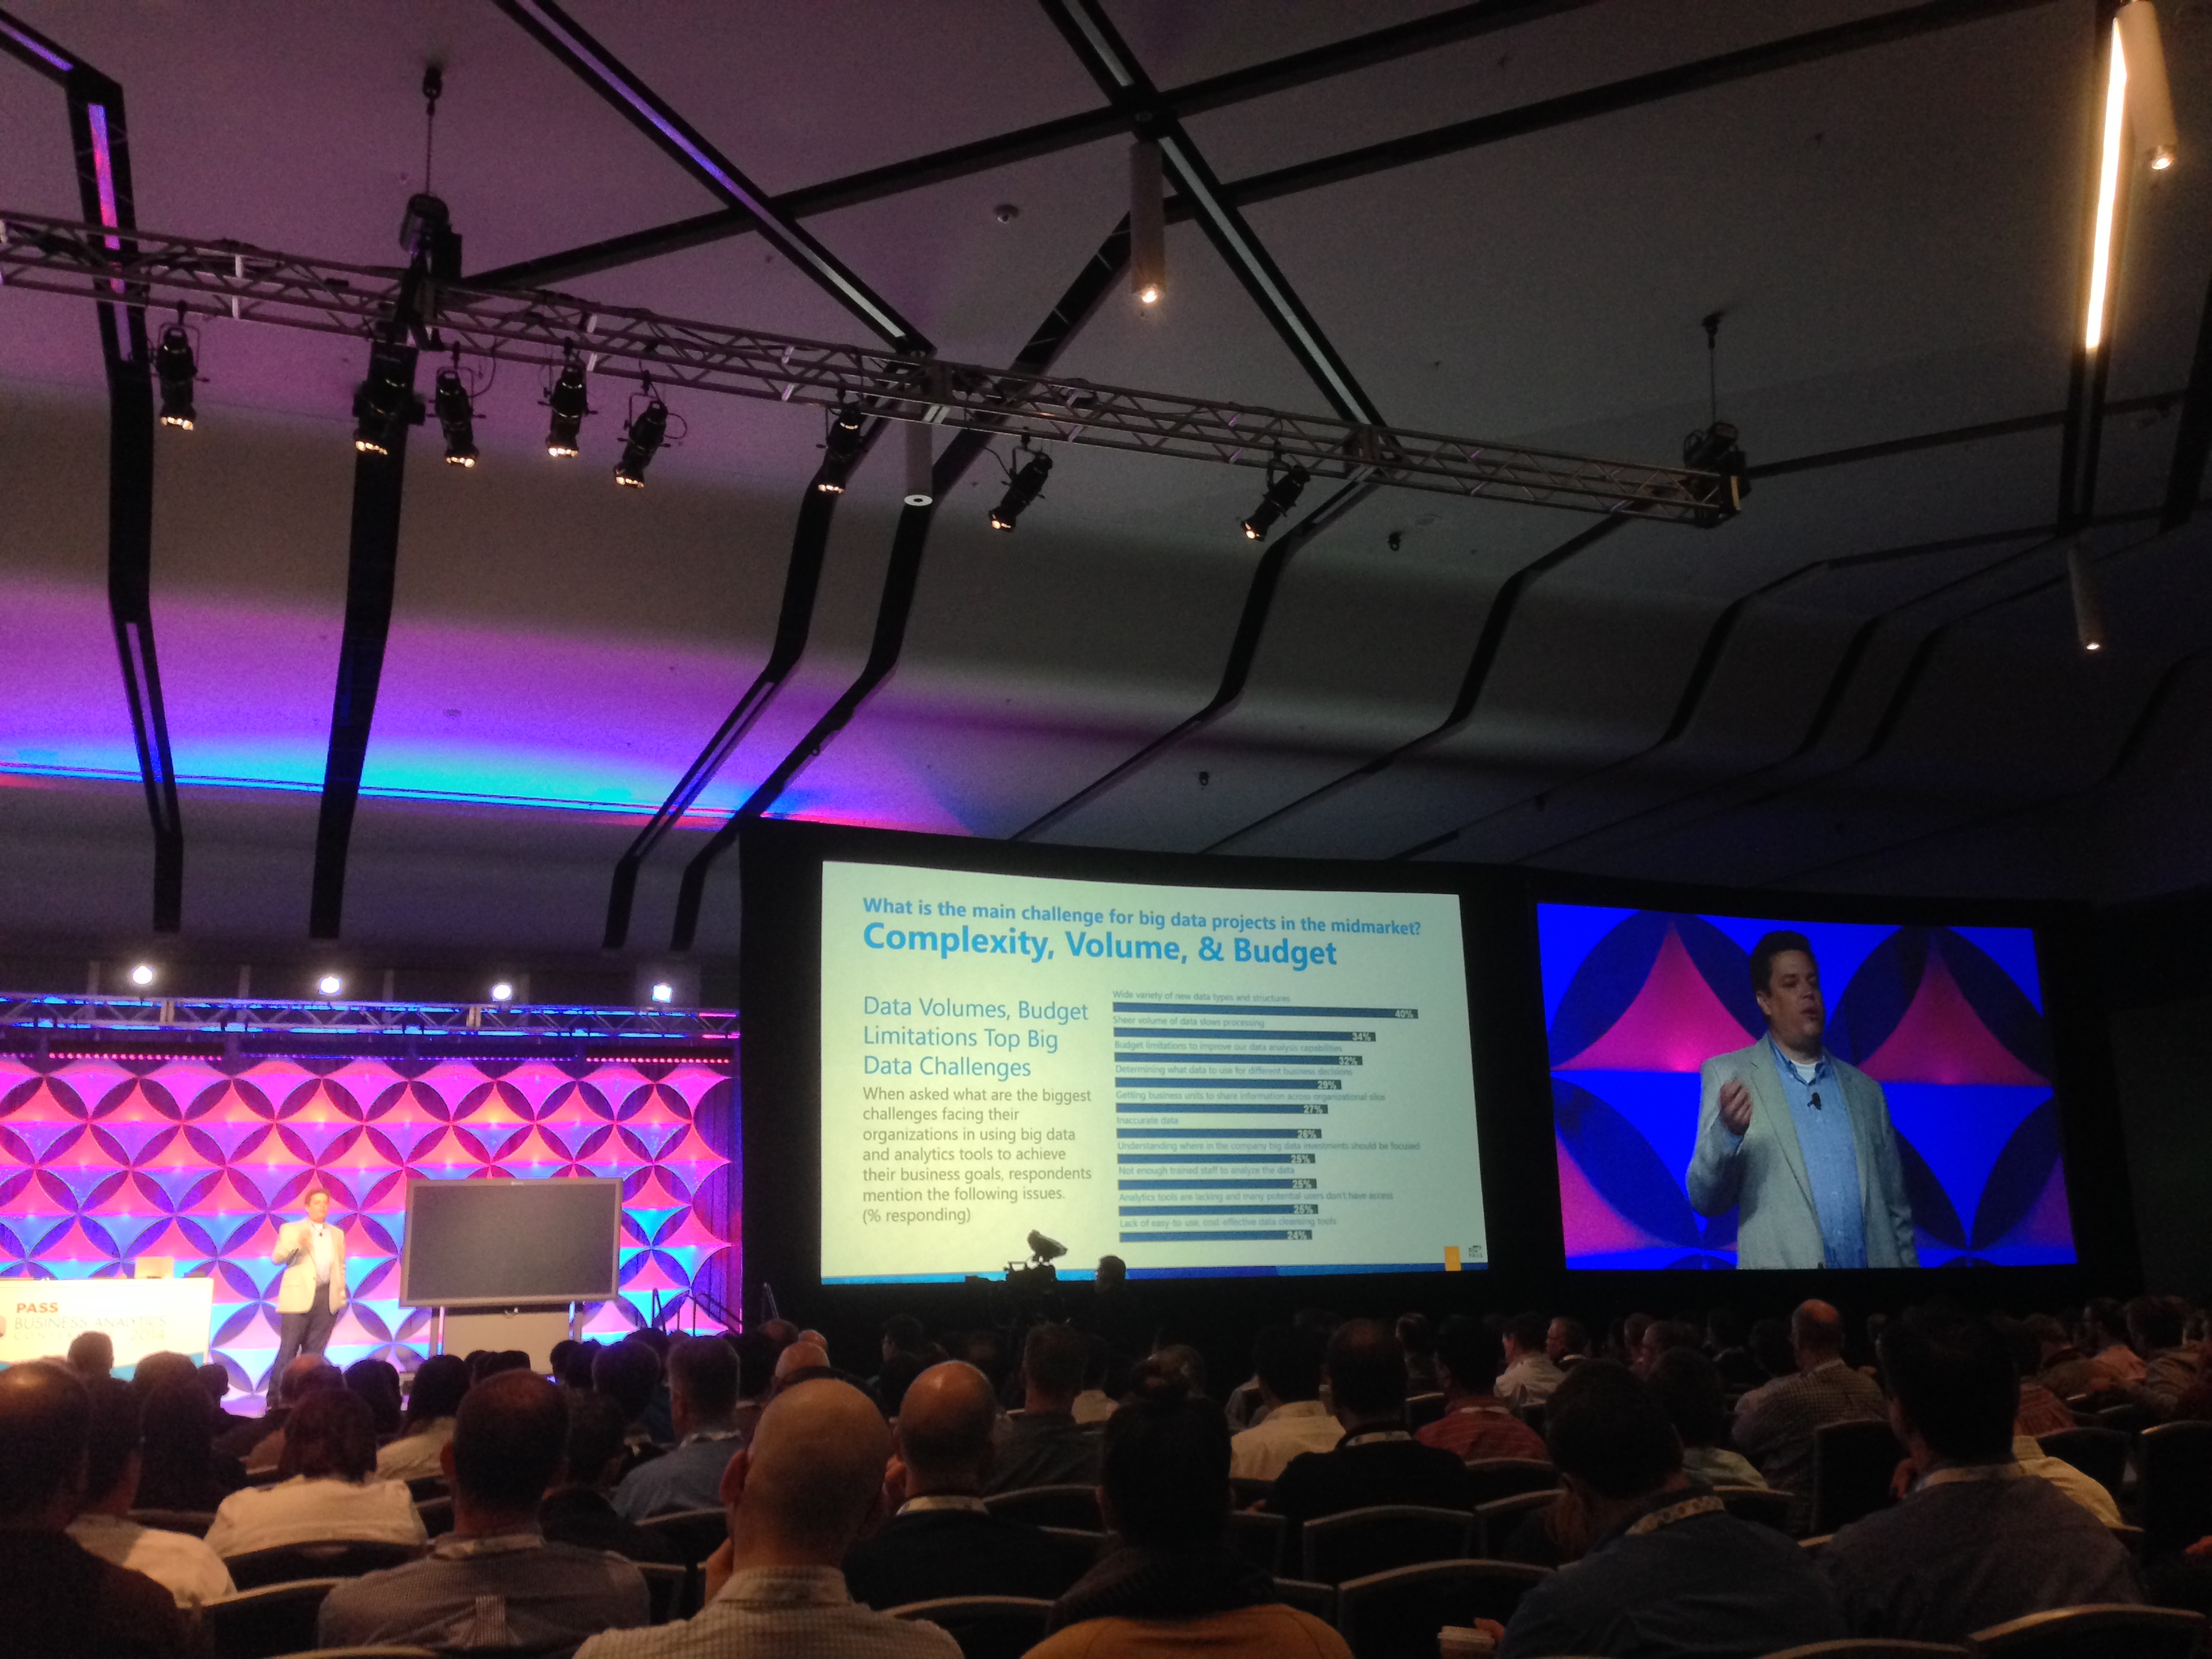 Thursday, 8th of May 2014, being the first day of the main conference was kicked off by Thomas LaRock (PASS President), following by some 15 minutes of the remarks delivered by the John Whittaker from Dell Software who was talking on the matters of the Big Data.
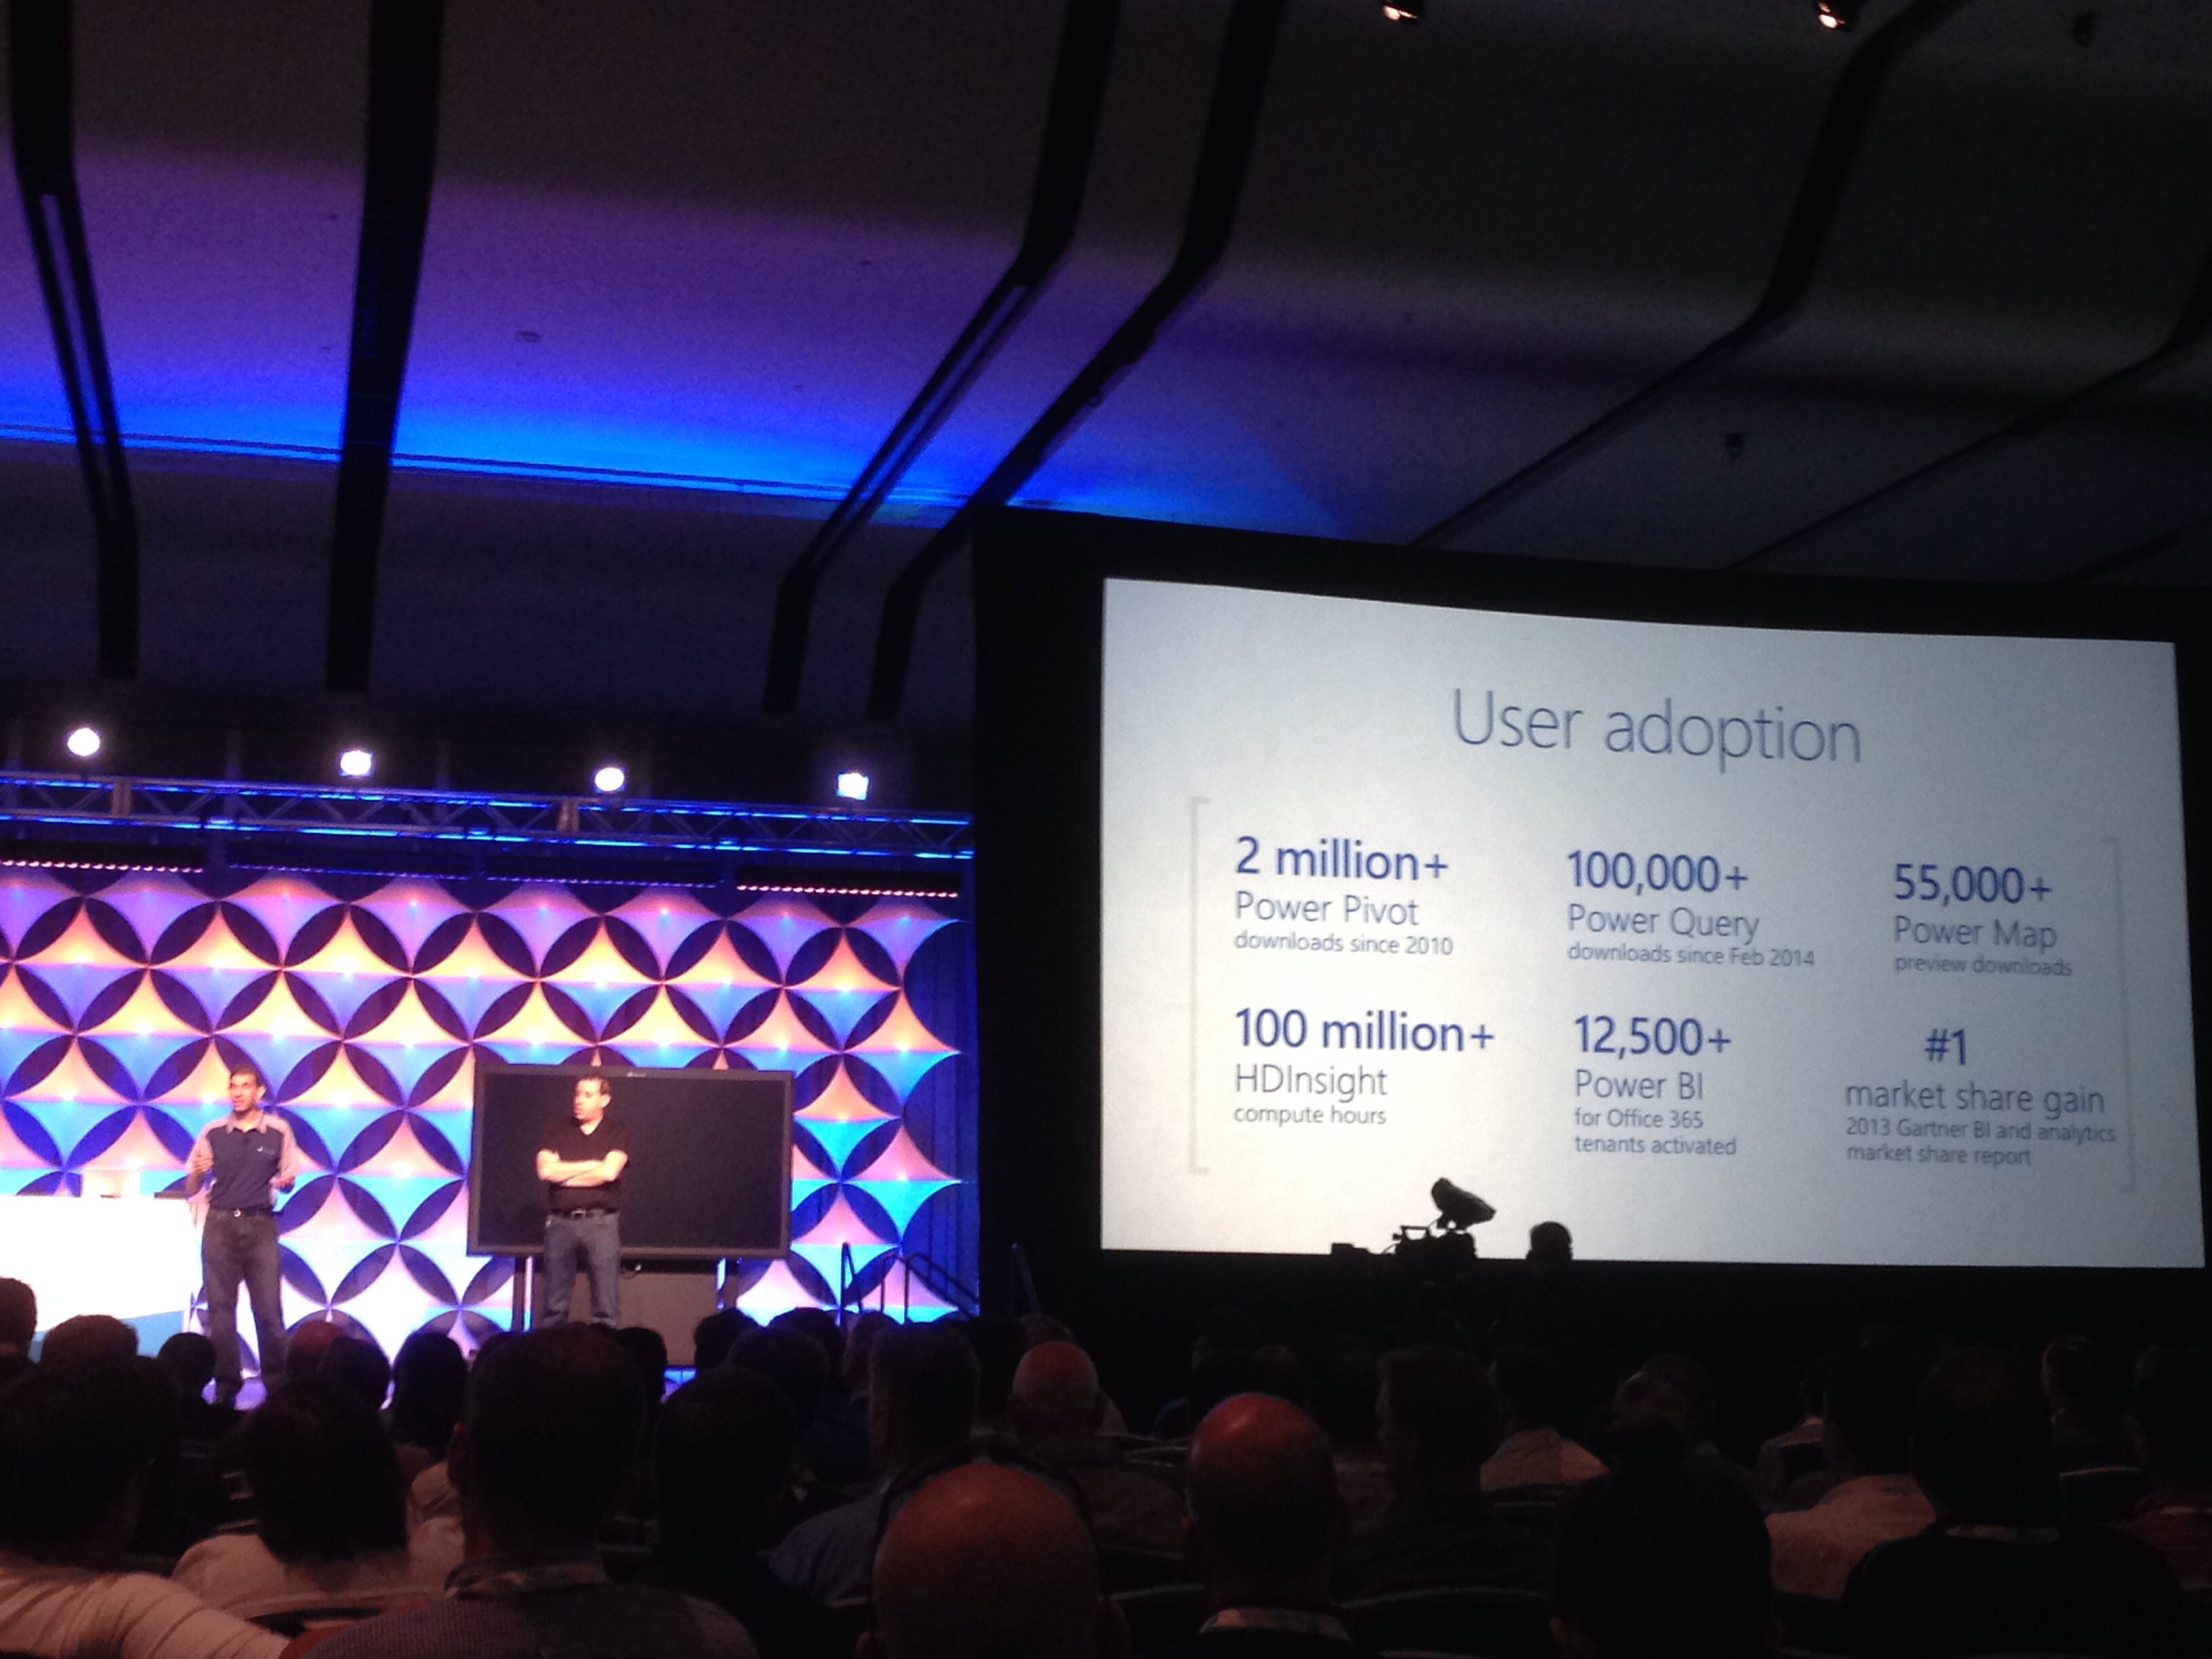 The most interesting part was the Keynote itself with Kamil and Amir entertaining the public while delivering a very interesting information. First of all they kicked off with some demos of the existing and well-known PowerBI functionalities. 2.000.000+ downloads of Power Pivot and over 100.000 downloads of Power Query (in less than 1 Year) are more than impressive.
It did not took them a lot of time to kick off with some major announcements, such as:
– A native PowerBI application for iOS (very important for the cross-platform adoption of PowerBI and there are so many IT Directors using iPads…)
– HTML5 version of PowerView (Nuff said, we need it NOW. Yes, I am not a very big fan of Silverlight which is crashing my visualisations quite often.)
— Native support for SSRS (wow, this is one of the things that were definitely missing)
— KPI Editor (Impressive, PerformancePoint is saying bye-bye, finally)
– Forecasting (TimeSeries), available at the moment of the announcement. (Wickedly impressive, I am definitely looking forward to start playing with them, especially the part that allows to show the forecasting into the past – hence showing the viability and the precision of the algorithm. This might be a deal-breaker for the Power Q&A adoption in my eyes.)
– Data Exploration Mode (It will allow to edit PowerView report on the fly, creating new tables & graphs. This feature is definitely touch-oriented, so you can drag a column and drop it on the graph. User will be able to Merge Graphs as well as separate them – really awesome features, they were called Bump & Shake respectively. :) )
– Tree Map Visualisation (Wow. PowerBI is definitely the most impressive and the most rapid improving piece of software that is coming out of Microsoft in my opinion.)
Friday Keynote
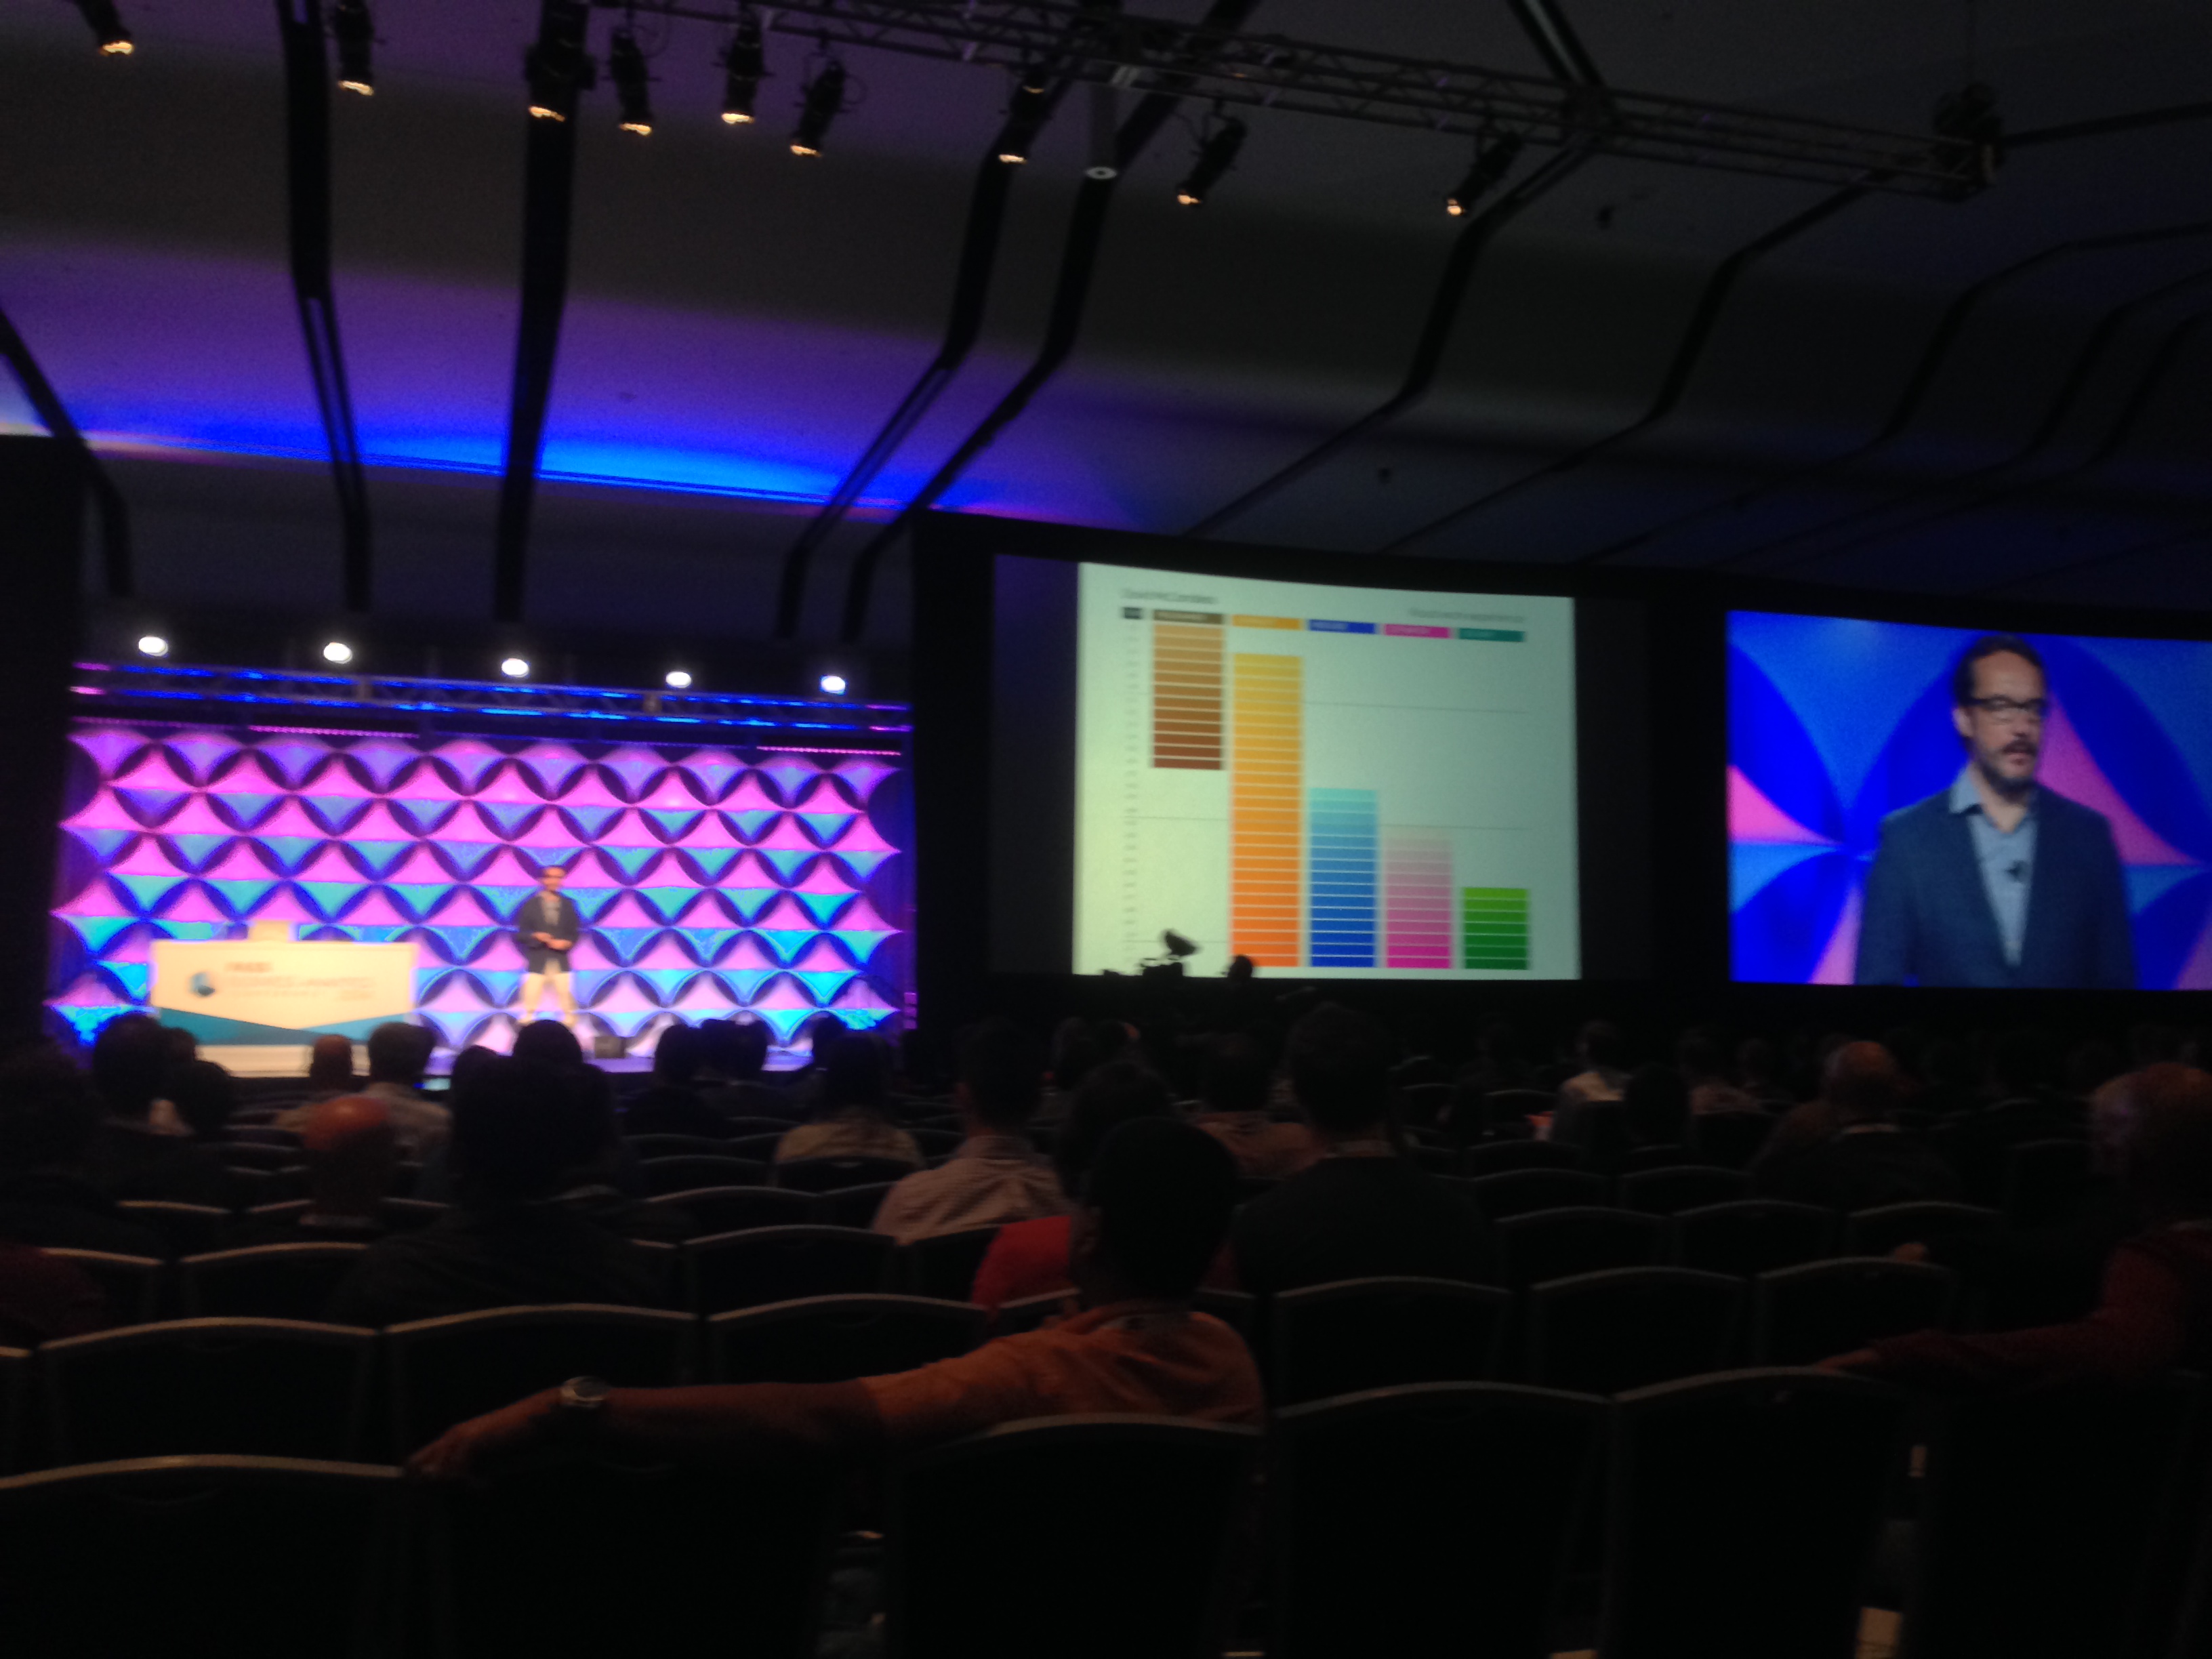 Friday kicked of with a short introduction made by awesome Denise McInerney (PASS Marketing Vice-President) and then David McCandless took over for a good hour of astounding visual storytelling.
I confess that I have never seen or read anything by David and so I was very impressed by his works. His presentation was extremely well-thought and well-timed. This was one professional presentation at the top level.
One of the most impressive things was a little animation (Debtris) that he has shown at 5:30 into the Keynote. Take a look at it, it is worth more then any words I could potentially write.
David was delivering a very important message that Data is the new Soil, while playing different entertaining games with public, making us guess different types of information.
He mentioned that he had never went to a design school (a lot of people in the visualisation & design has actually made the very same decision) and he motivated people to dive into the world of the information and visualisation.
Here are some of the examples that he has referred to during his presentation:
– Size of the armies (and the relation to the budget and the total population of the respective countries)
– Potential Number of the communicating Civilisations in the galaxy
– Horoscope Analysis (very funny analysis from the Yahoo data)
– Commonly used PIN Numbers (scary to think what most people are keep on using)
– Twitter (great view if whole users would be just 100 people)
I was lucky to get a copy of David McCandless book signed by the author himself, which I am looking to finish reading before the end of the June and I guess that I will be keeping his amazing book Informational is Beautiful on my table for the years to come :)
to be continued with PASS Business Analytics Conference 2014 Recap, part 2