As I am finishing this blog post after 3 month of never finding the right words to do so, I can’t escape the feeling that the eventual break for a couple of weeks from blogging that happened to me in June 2020 has really helped me to shape the examples the way I wanted.
One of the most common situation everyone has faced so frequently in live is
when someone wants to point something particular (as in negative) to someone, so many times they choose some singular event, instead of looking at the bigger picture.
I guess this is just a choice of justification, instead of trying to understand and finding the real pattern – yeah, that’s because it is truly a hard damn work.
Let me kick of the idea with a real-world example that just happened to me:
A Wasted day
Today (this was an early April of 2020), I was talking to my daughter who is almost 8 years old and was asking her the following question:
– “If you have not done anything a couple of hours, are you being lazy?”; She said “No”
– “What about a day?”; She said “Still No”
– I insisted “And what if it would be a whole week?”; She said “Well, that’s too much…”
– My expectation was that she would answer that way, and so I asked again “But what if the week is a vacation week?”; She instantly reacted “It would be totally fine, then!”
Indeed…
Between people who know me, there is a known fact that I am not a kind of person who likes the personality of Bill Gates, but the phrase that is apparently attributed to him is something I remember a lot of times and it inspires me frequently to carry on -Â “Most people overestimate what they can do in one year and underestimate what they can do in ten years.”
If your data is very granular, you will be going through ups and downs, in a rush of excitement and incredible downs, while the whole thing might just be pretty average (I am definitely opening a can of worms here, since I have previously expressed and written pretty much of my dislike of averaging anything :)).
It will sound like “We are the best! … Oh no we are the worst of the worst! … We rule … No, we don’t deserve … ”
This sounds like a person who needs a good professional medical advice. :)
You can’t measure against yourself, because you have a brand new you, every single day, every single hour, every single minute…
But if you still want to insist, measure meaningfully and respectfully.
Humans are so bad at prediction that we spend so much time in searching for the pattern just to justify our choice.
Group your data up and stack it together on a monthly or better – yearly, or maybe decade basis.
Do your best in being consistent, but don’t worry, because unless you are a robot or one of the incredibly amazingly-organized people, you will fail.
You will fail frequently, very, VERY frequently.
Before going any further, a disclaimer – I am NOT QUALIFIED to make any judgement on this matter, since I am not a statistician, nor am I an epidemiologist. I am just a guy who likes to interpret the data, and I AM DEFINITELY NOT REPRESENTING HERE ANY POINT OF VIEW, BESIDES THE FACT THAT NUMERIC ANALYSIS IS NEEDED TO BE DONE WAY BEYOND DAILY GRAIN.
Think about the whole covid-19 analysis that was and STILL IS being done in the mainstream on Twitter and LinkedIn, mainly with a daily grain, instead of focusing on the bigger picture, such as grouping data by the week, or using a sliding window of a week, but not just a single point of measurement. And don’t forget the tolerance of the measurement errors, plus the real life need to be accounted for some of the sudden changes, etc …
A whole new story can be told from this basic perspective and there is so much more that can be done, well beyond the basics.
After leaving this post unfinished for a couple of months, I was able to find a good example with my own blogging habits.
Blog Posts
Consider blog post from my site, I blog randomly. I blog when I feel like blogging. I blog when I find time for it.
There is no schedule. I have my targets, but I fail them miserably and that’s fine, because I am doing this for me and if someone finds a value – you are welcome.
I do not know the future, maybe I will retire my tech blog and get back to poetry and smash it with dozens of poems per year, I do not know, but I am here excited to discover. :)
Anyway, back to the number of my blog posts – let’s take a look at the year 2019:
 It looks like my blog post output had a major failure in the first half of 2019 but by June-July I have started to recover and reached a pretty good output in october of 2020. What would one expect from 2020 ?
(a little explanation – indeed I was very much overworked and overspent in the first half of 2019)
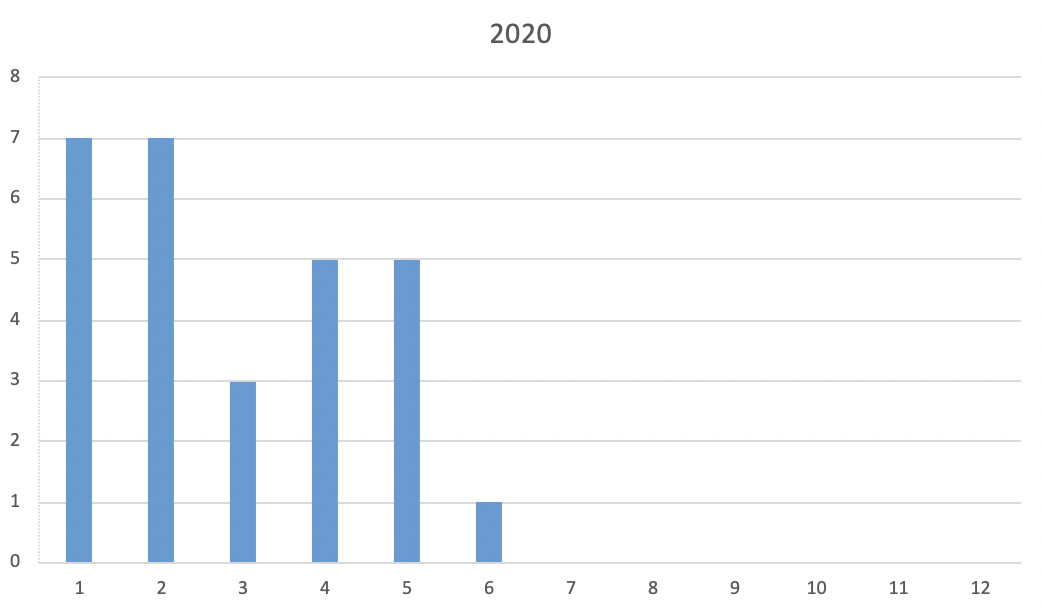 By looking at the monthly numbers of 2020, I can only arrive to the conclusion that I kicked off the year in high gear, but by the June I felt into the oblivion by pretty much lowering my output into a small little blog post in a whole month (tell it to the people who do not blog :)). There must be a crisis around! (Probably something that I am not aware off :) haha)
Certainly we have no idea about the second part of the year at this point (as I am writing this on the 9th of July), but overall tendency might be something to be aware of, right? RIGHT ?
 The interesting things start to happen when we overlap the years – I see that actually the first half of the year in comparison with 2019 was very, very productive and that there is no need to do the math that the situation is totally incomparable. The only month where the pure number of blog posts (not the quality, that’s a different conversation) is lower in 2020 then in 2019 is the June. In reality this was the less productive blogging June in 7 years, since 2013 to be more precise.
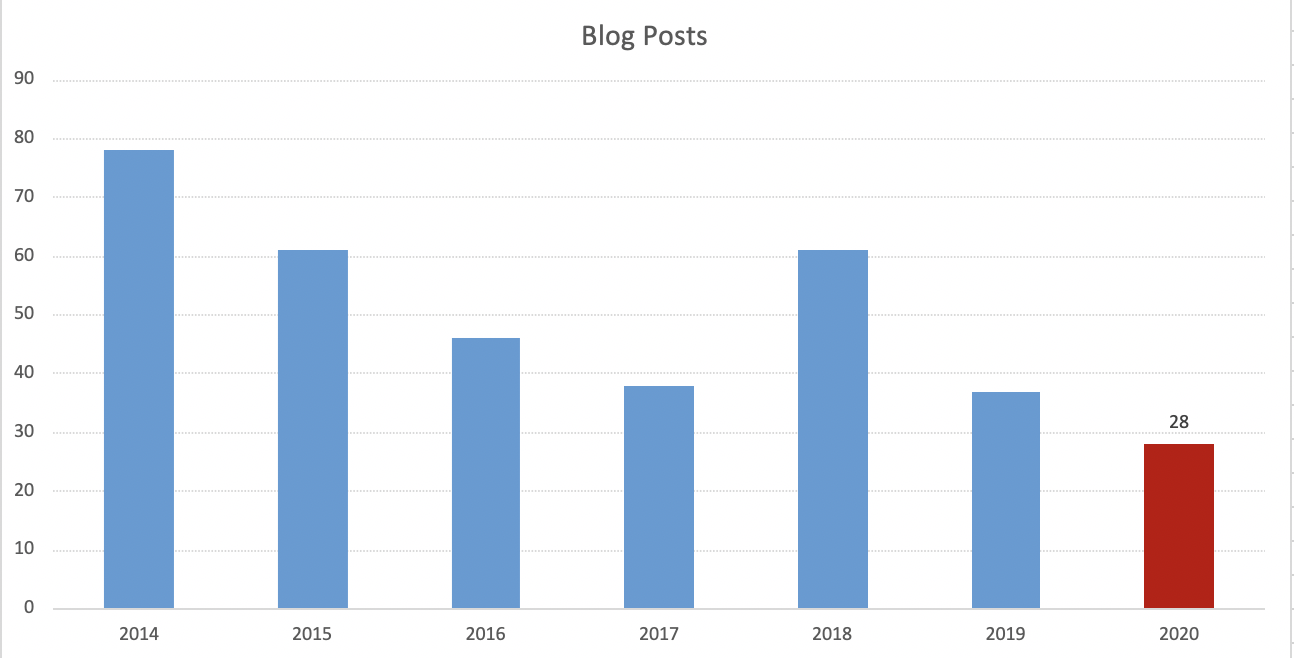 When we group the data by year and explore the bigger, there is something quite visible – right now the sheer number is on the way to hit the 4th best year ever, by let us hypothetically calculate 56 expected blog posts (the double of the first half, the sum of the first half and the averages for the last 6 months will get to the very same result of 56. I expect this number to be totally wrong – I will try to make sure it will be wrong :)).
The bottom line
Know and understand the origin of the data, before you start analyzing it. And if you are into Machine Learning … you better understand its exact impact on the algorithm choice.
Always play with your data grouping up and drilling down, to see different points of view,
but most of all – at least GROUP IT UP to see the biggest picture possible.
I mean, I understand the urge to start writing poetry when you have such awesome, inspirational clients working with you. But why choose between poetry and SQL? Why not both? #mindblown
Hey Francisco,
It is a deal!
I will totally deliver/rap some poetry during one of my next client engagements!
Best regards,
Niko