This blog post is a part of the whole Batch Mode series, which can be found at the Nikoport Batch Mode page.
Question When does the Query Optimiser decides to let the Batch Mode to take over the query execution ?
Warning: There is no and will no be definitive & authoritative answer on this question.
This is something that Microsoft has very clearly stated that they will change and modify behind the scenes without any warning, while keeping the functionality as stable as possible.
Given that at the moment of this article creation, the freshly published version of the SQL Server 2019 is still in the CTP and to be more precise in the first public CTP phase, I expect this information to change very drastically in the future.
But let’s take a look and see if we can get to understand the basics ;)
Taking a look at the number of different publicly available sources in the documentation and blog posts from Microsoft, one can arrive to a following conclusion:
In order for a given query to get the Batch Execution Mode we need one or multiple items:
– to use an analytic operator, such as a hash join (Inner Loop & Merge Joins are obviously out of the consideration)
– to use and aggregation operator
– to involve more then 100.000 rows
Let’s keep the following in mind, while we start experimenting: “There is no guarantee that query plans will use batch mode. The query optimizer may decide that batch mode does not look beneficial for the query.”
and additionally – just because documentation states something, it does not mean that it is precisely works that way. :) I could have spent hours pointing to the wrong documentation articles, but I am also a strong believer in paying the documentation writers. :)
Extended Event batch_mode_heuristics
There is a brand new Extended Event on the block that is specifically designed to help out with understanding of the Batch Mode enabling decisions – the batch_mode_heuristics.
I would like to point here that it looks that this decision mechanism is being applied to the Batch Mode over Columnstore Indexes as well, so stay tuned for a new blog in the Columnstore Blog series!
If you are unable to find it right away, please do not forget to enable the “Debug” channel in the events panel of the Extended Events creation. :)
The list of the properties is large, and here are the details that I have extracted from the sys.dm_xe_object_columns DMV:
- is_query_plan_using_batch_processing – Is the query plan using batch processing?
- is_batch_processing_enabled – Is batch processing enabled?
- is_batch_mode_enabled_unconditionally – Did we unconditionally enable batch processing rules?
- is_batch_mode_enabled_by_heuristics – Did we enable batch processing rules for this query using heuristics?
- are_plan_affecting_actions_allowed – Are we allowed to enable or disable batch mode?
- was_batch_mode_ever_considered – Was batch mode considered?
- found_interesting_global_aggregate – Did we find a promising GbAgg in the input expression?
- found_interesting_table – Did we find promising tables in the input expression?
- found_interesting_join – Did we find a promising binary join in the input expression?
- found_interesting_nary_join – Did we find a promising n-ary join in the input expression?
- found_interesting_window_aggregate – Did we find a promising window aggregate in the input expression?
- last_optimization_level – Optimization level in which we might have turned off batch mode.
- total_batch_cost – Total cost of significant batch operators in the current solution.
- total_ignored_cost – Total cost of operators we ignore.
- total_cost – Total cost of the current solution.
- found_significant_batch_operator_in_solution – This is when every other thing is true but you still don’t see batch-mode in the final plan, because the batch-operator did not cross the cost threshold to be considered for batch-mode.
- found_batch_operator_in_solution – Is there a batch operator in the solution?
Right after reading this information, one could easily identify some of the drivers for the decision to enable the batch mode.
– Do we have the Batch Mode possibility enabled ? For that purpose for the Rowstore Indexes we are talking about the setting in the database scoped configuration: BATCH_MODE_ON_ROWSTORE = ON / OFF, while I have no information right now if there is an option for controlling the Batch Mode for the Columnstore Indexes, but hey – there are always trace flags that can be helpful in some cases.
– Is there some block preventing our execution plan to get Batch Execution Mode ? I am guessing here that we are talking about the Batch Mode limitations, that would disqualify the execution plan from getting Batch Execution Mode.
– Is there some forcing of the Batch Execution Mode (is_batch_mode_enabled_unconditionally). I am making a guess here that there might be a switch that I would love to have, that would force the Batch Execution Mode indecently from the analysis and heuristics, simply because sometimes the estimation can go wrong (the edge cases).
– The global aggregations are major supporters for the Batch Execution Mode (and no surprise here). Overall aggregating data (grouping and calculating is the first major step in order to get
– There can (or is it a must) be an interesting table for the Batch Execution Mode to kick in. I am guessing it has to do with the cardinality estimations and those 100.000 rows
– A join that produces a huge number of rows can trigger Batch Execution Mode (can we take a couple of small tables and cross join them in order to get it working?)
– A join with N relations (so-called n-ary or “nary”) where n is probably a number equals and superior to 3 (ternary relations), I am guessing here that the required number of rows can go here quite a bit down, because just joining itself and the complexity of the query will give enough CPU work.
– An interesting window aggregate is always a great candidate for the Batch Execution Mode, especially because since SQL Server 2016 we have a special iterator for the Batch Execution Mode. The pure calculations should definitely provoke a situation where Batch Execution Mode can become very useful.
– It will come down to the estimated cost, and if there is an execution plan with the Row Execution Mode that is estimated to be cheaper than the Batch Execution Mode, we will not be getting the Batch Execution Mode then.
– There is some internal Batch Execution Mode threshold that needs to be crossed in order to get a Batch Execution Mode. For bigger tables this should be pretty much a no-brainer, I guess that this is more for the border-line situations when undesired amount of resources are spent on rather trivial tasks.
The initial tests
For the testing purposes I will be using a 10GB TPCH sample database, that can be easily generated with the help of the free software, such as the HammerDB.
Let’s pick a rather small 1.5 Million Rows table dbo.customers and run a couple queries, while observing the Extended Event batch_mode_heuristics:
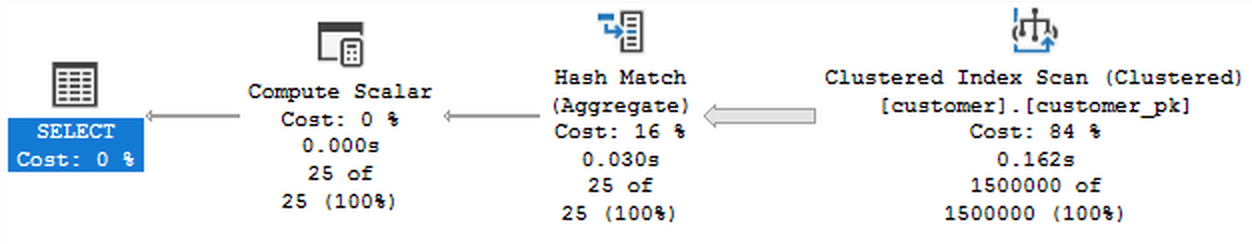
SELECT COUNT(*)
	FROM dbo.customer;
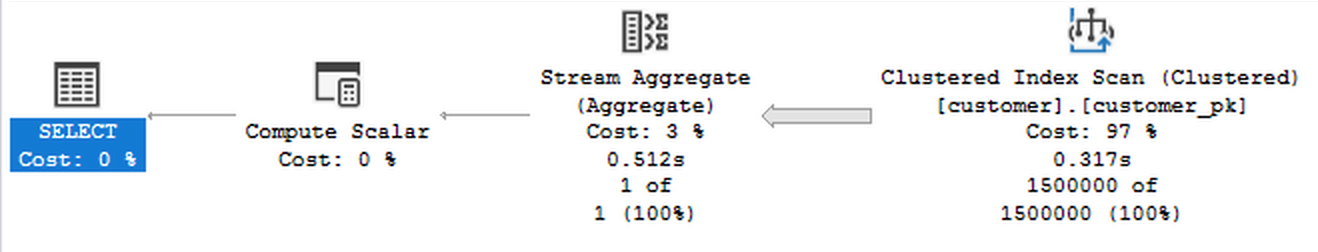
 Looking at the execution plan on the picture above, you can make an educated guess that even though we are dealing with 1.5 Million Rows and we are aggregating the count of the rows (and on Columnstore Indexes we would definitely get the Batch Execution Mode), the presence of the Stream Aggregate iterator points to the fact that our query is being executed in the Row Execution Mode. This was not the most expected outcome for me, especially since the improvement for the Columnstore Indexes & Batch Execution Mode in SQL Server 2017, but given that we do not expect every single query on the Rowstore to get the full optimisation level, it is ok when we face such situations. The solution for this query would be to raise the estimated cost with the help of such tricks as WHERE 1 = (SELECT 1) or any other appropriate.
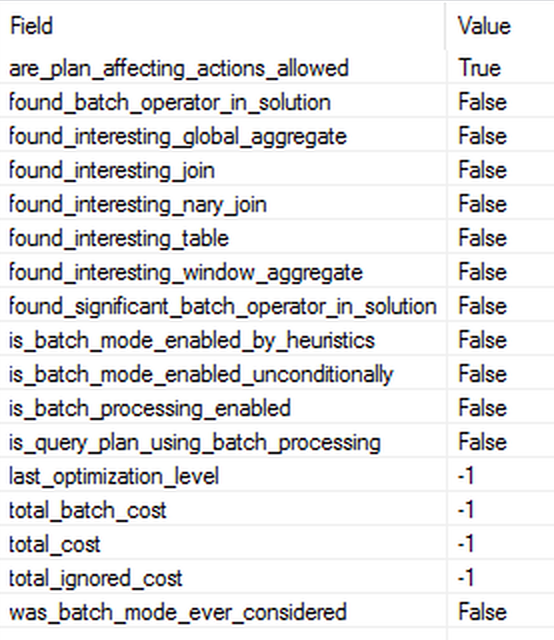
From the shown properties of the Extended Event batch_mode_heuristics, the only one set to true is the are_plan_affecting_actions_allowed, which is understandable, given the query used optimisation level.
Let’s run the same COUNT(*) query on something bigger, like against the lineitem table which has 60 Million Rows, and which processing cost will be significantly superior to the set “threshold for parallelism”:
SELECT COUNT(*)
	FROM dbo.lineitem;
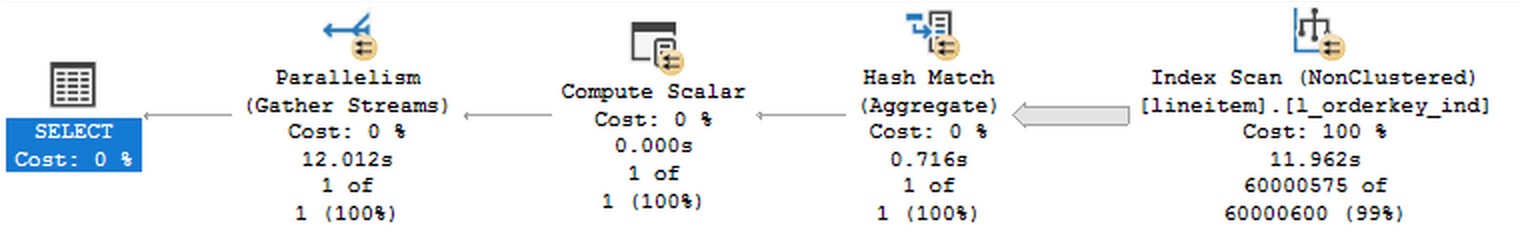
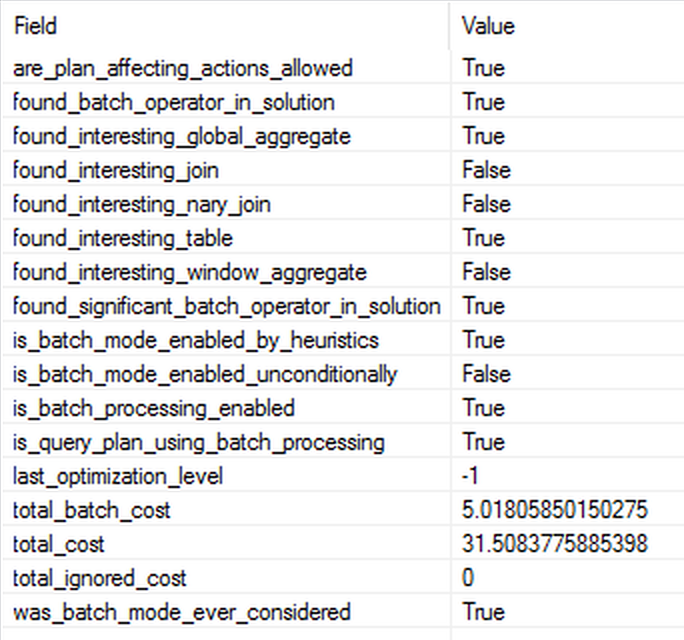
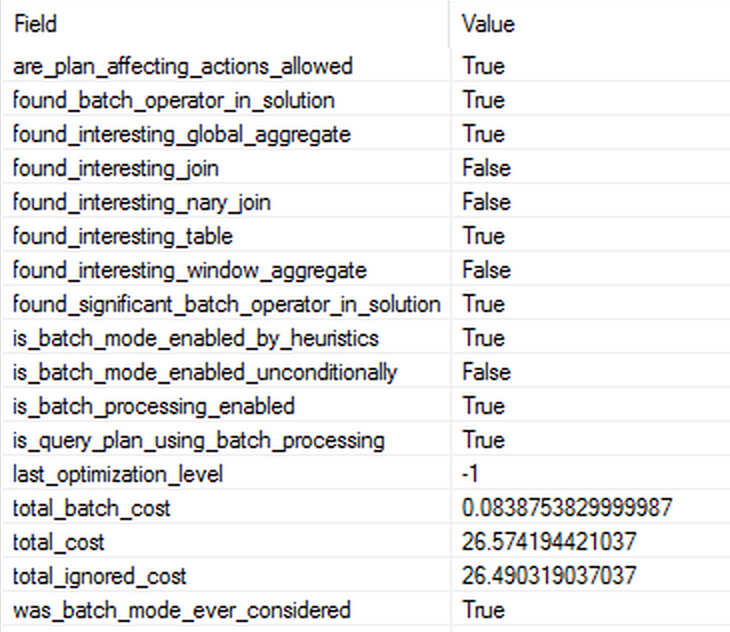 This query gets a full optimisation level, mainly because its cost goes over the threshold for parallelism cost and thus is fully optimised with the possibility of and as the matter of a fact it does gets the Batch Execution Mode. Paying attention to the properties of the batch_mode_heuristics gives us an idea that the table was found interesting (makes sense, 60 Million rows!), found_batch_operator_in_solution & found_significant_batch_operator_in_solution are activated, but mostly I am paying attention to those found_interesting_% properties where the found_interesting_global_aggregate is shown to be set to true. The property “is_query_plan_using_batch_processing” is the one that tells us if the Batch Mode is present in our query execution plan and given that we are not mixing Columnstore Indexes with the Rowstore ones (a caveat for not starting to celebrate if you see it, because maybe your Rowstore tables are excluded). The last but very much not least the costs (total_batch_cost, total_ignored_cost & total_cost) tells us the story of how much better the Query Optimiser thinks that the introduction of the Batch Execution Mode will improve the query execution and please notice that it seems to have less to do with the numbers of the Estimated Costs in the execution plans, but rather to be some internal calculations.
Let’s experiment with a bit more complete aggregation query, that will use some grouping on our data, back on the principal test table dbo.customer:
SELECT [c_nationkey],
	SUM([c_acctbal]) as TotalAccountBalanace
	FROM dbo.customer
	GROUP BY [c_nationkey]
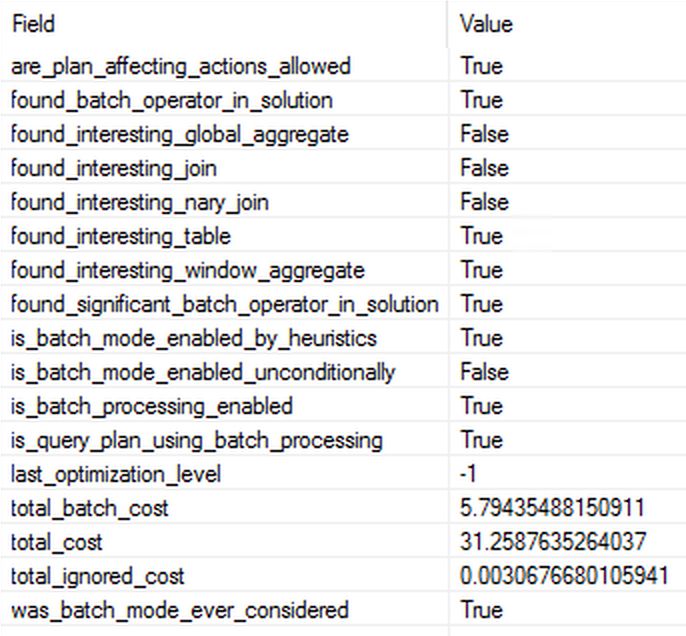
 The execution plan runs in the serial mode and it is getting the Batch Execution Mode. The property found_interesting_global_aggregate seems to be our principal driver for the successful usage of the Batch Execution Mode. The thing that I find truly interesting in the shown properties is that the total_ignored_cost equals to 0 – is this a CTP mistake or is this an information that full circle of the optimisation was used and every single operator cost was included ? The overall execution time of this query is less than half of the same query that would run in the Row Execution Mode – this leaves me very much excited about the possibilities that someone upgrading to SQL Server 2019 can be hugely surprise by sudden speedups in the performance of certain queries.
Disabling Batch Mode
Let’s re-run the same query, but this time let’s make
SELECT [c_nationkey],
	SUM([c_acctbal]) as TotalAccountBalanace
	FROM dbo.customer
	GROUP BY [c_nationkey]
	OPTION(USE HINT('DISALLOW_BATCH_MODE'));
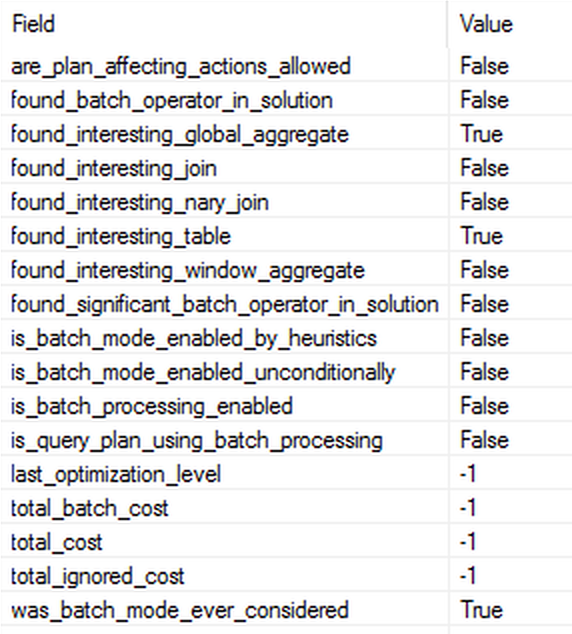 While the execution plan for this query stays absolutely the same, all iterators are being executed with the Row Execution Mode. Looking at the monitored Extended Event properties, we can find out that the are_plan_affecting_actions_allowed property is disabled and even though an interesting table with an interesting global aggregation are found, and even though the batch mode was considered, it was not used within our execution plan. All other properties are set to false and the total costs are set to -1, which I think is pity, because even if those considerations were discarded (forced by our user hint), they can be sometimes useful as in order to show someone how much of improvement they have potentially lost.
Now, let’s take a look at the query that does no aggregation, but includes a window function
SELECT TOP 20 [c_nationkey],
	SUM([c_acctbal]) OVER
		(PARTITION BY c_nationkey
		 ORDER BY c_nationkey
		 ROWS UNBOUNDED PRECEDING) as TotalAccountBalanace
	FROM dbo.customer
	WHERE c_acctbal > 1000
	ORDER BY SUM([c_acctbal]) OVER
		(PARTITION BY c_nationkey
		 ORDER BY c_nationkey
		 ROWS UNBOUNDED PRECEDING) DESC;

 Besides not the most trivial execution plan, we can see the properties of the Extended Event batch_mode_heuristics that this time as expected with no interesting aggregations found, there was an interesting window aggregate that helped this query to get the Batch Execution Mode, as the property found_interesting_window_aggregate is set to true. Another interesting detail here is that so far it was one of the few cases against the simple table where the heuristics voted in the favor of the Batch Mode as well. The other attribute that has flipped the switch to true was found_significant_batch_operator_in_solution, showing a very good (and in my books a very healthy) preference of the Query Optimiser to favour the Window Aggregates for using the Batch Execution Mode.
Looking at the actual execution time of this query running with the Batch Execution Mode and the one without – we can get an absolutely astounding result of 0.1 Seconds vs 1.4 seconds, representing on my Machine an almost 15 times improvement!
Lets consider a rather intensive join between the orders & lineitem tables
DECLARE @d as INT, @v as MONEY

SELECT @d = datepart(yy,O_ORDERDATE),
	@v = L_EXTENDEDPRICE*(1-L_DISCOUNT)
 FROM LINEITEM, ORDERS
 WHERE L_ORDERKEY = O_ORDERKEY
 AND O_ORDERDATE BETWEEN '1995-01-01' AND '1996-12-31'
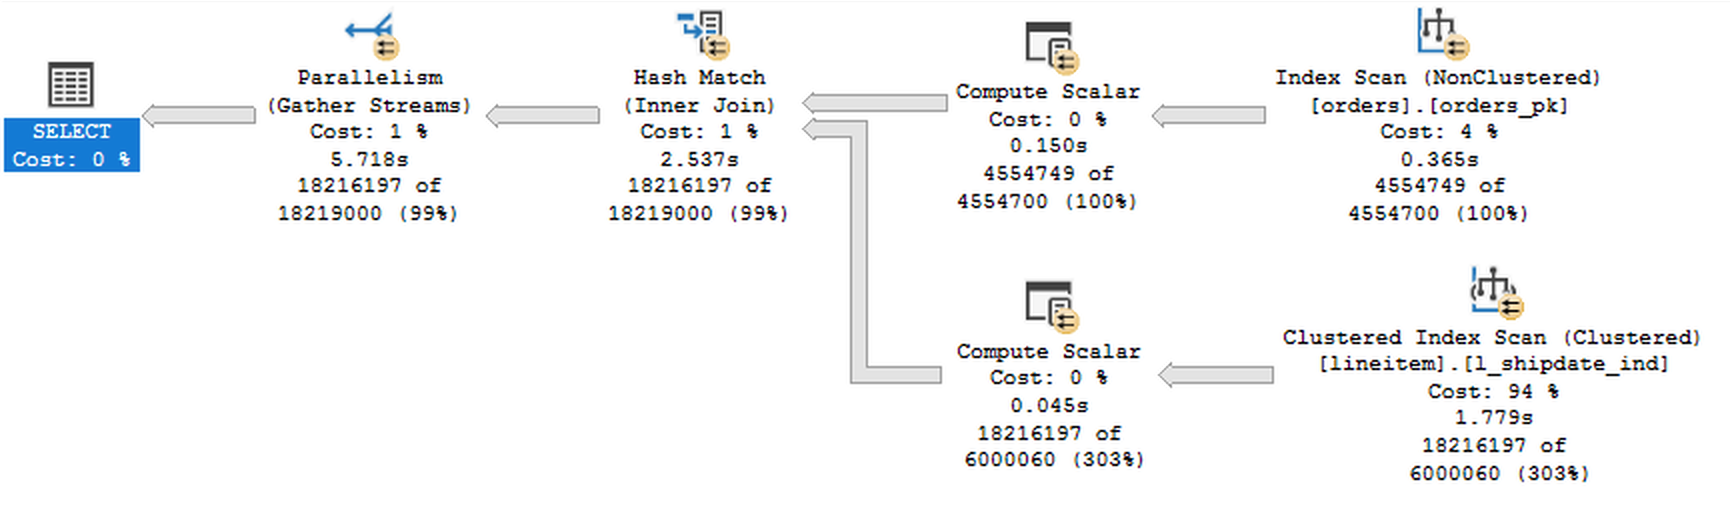
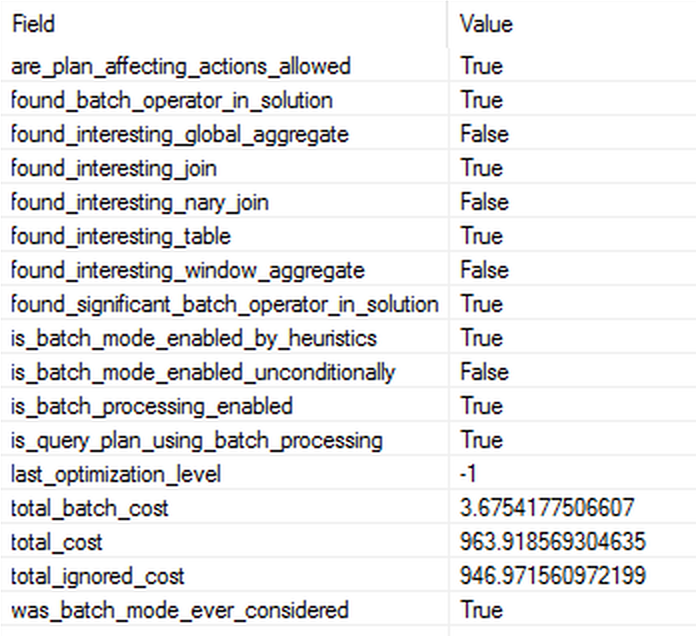 The execution plan above is pretty much simple and its the properties of the batch_mode_heuristics extended event is that we are interested in. In this case we have the interesting table (well, there are 2 to be precise :)) and an interesting join are found. The heuristics in this case should not be able to lie since we have both tables have large millions of rows and as a result we are receiving 18 million rows. :) The one thing I keep wondering about is why the ignored cost was so high, because to be honest, in practice the difference between running the query in Batch Mode and running in the Row Execution Mode is not even reaching 80% – I would definitely expect a different result.
N-ary joins
A very good example of the N-ary join would be the TPCH Query Number 5, which I successfully executed against the TPCH database:
SELECT N_NAME, SUM(L_EXTENDEDPRICE*(1-L_DISCOUNT)) AS REVENUE
FROM CUSTOMER, ORDERS, LINEITEM, SUPPLIER, NATION, REGION
WHERE C_CUSTKEY = O_CUSTKEY AND L_ORDERKEY = O_ORDERKEY AND L_SUPPKEY = S_SUPPKEY
AND C_NATIONKEY = S_NATIONKEY AND S_NATIONKEY = N_NATIONKEY AND N_REGIONKEY = R_REGIONKEY
AND R_NAME = 'ASIA' AND O_ORDERDATE >= '1994-01-01'
AND O_ORDERDATE < DATEADD(YY, 1, cast('1994-01-01' as date))
GROUP BY N_NAME
ORDER BY REVENUE DESC;
and while the execution plan is too complicated to be presented at once, here is the picture of the overview:
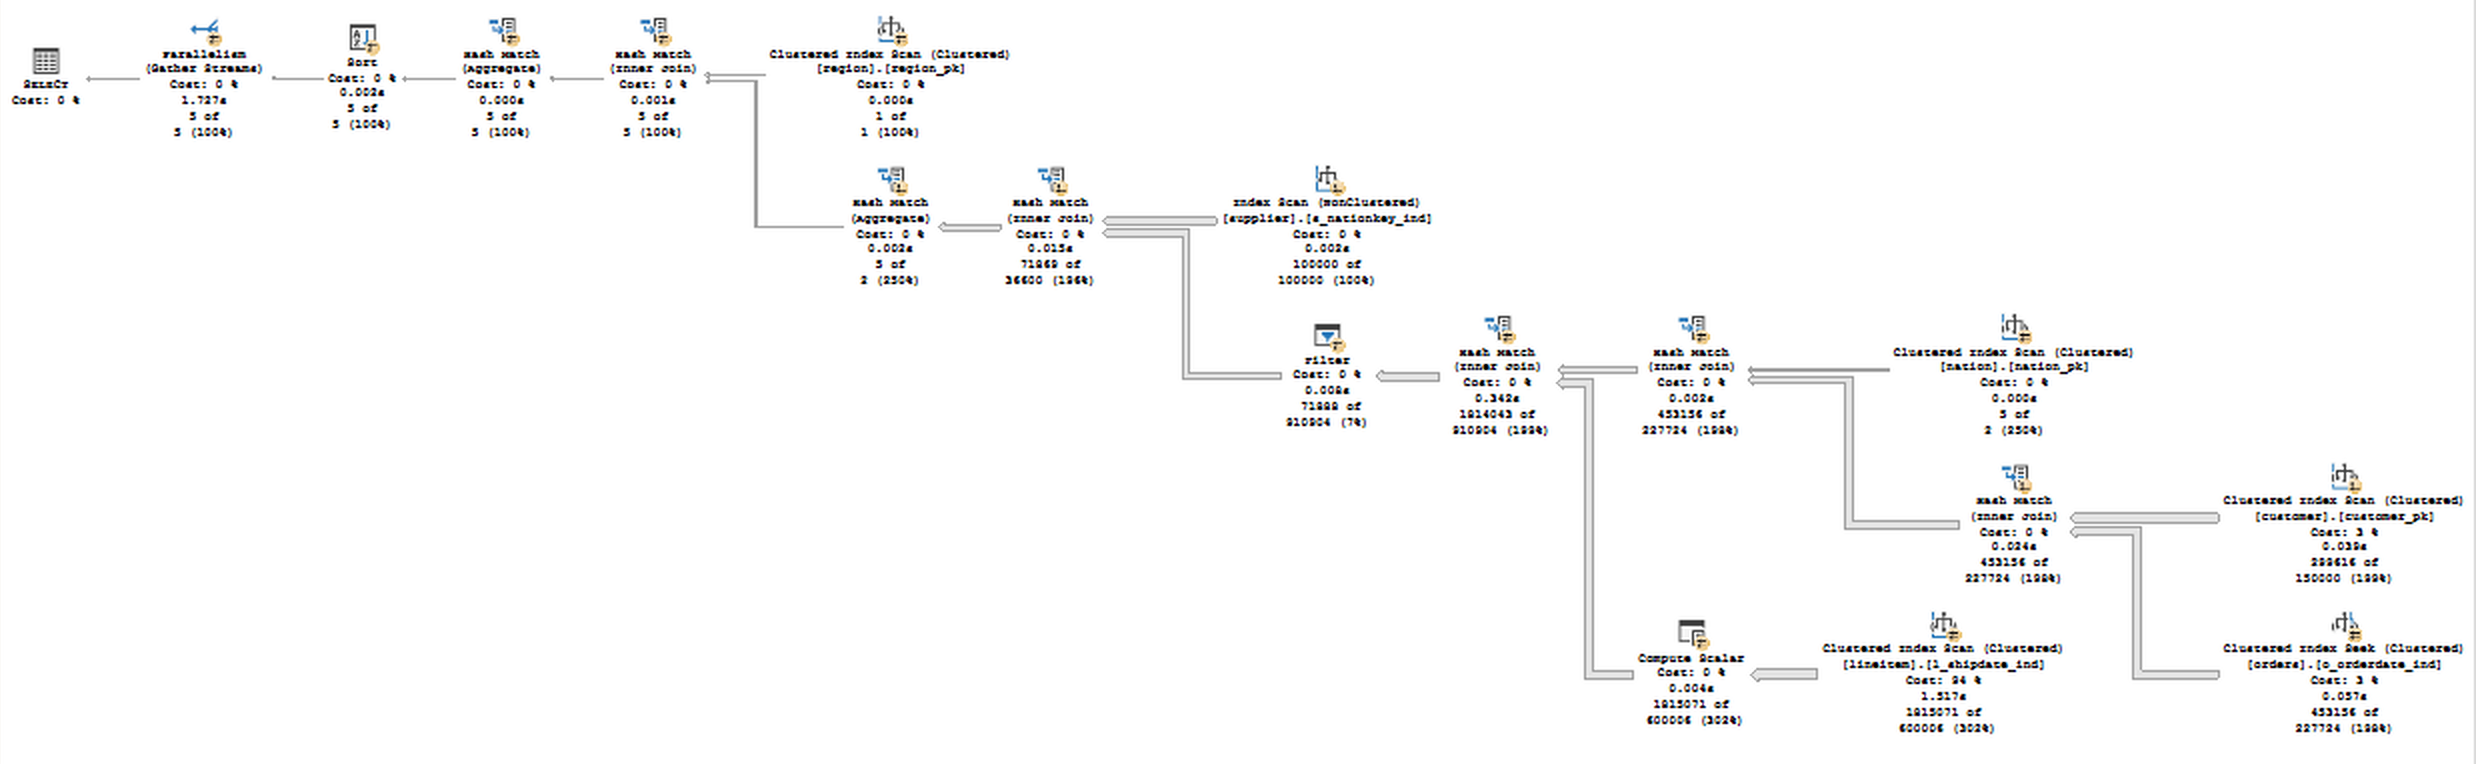
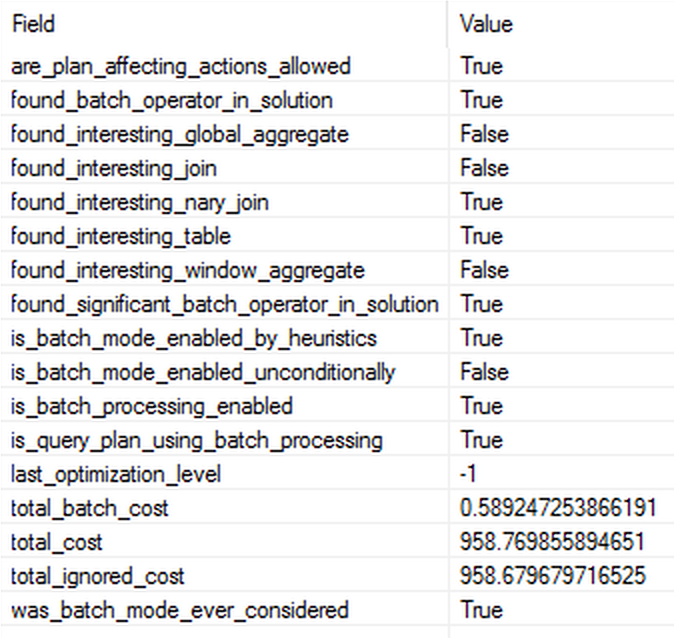 Observing the properties of the Extended Event shows us that our N-ary join was one of the principal causes for the Batch Execution Mode - there are no Window Aggregates, no Global Aggregate and no reasonable Join to have caused it otherwise. Remarkable property in this query is the total_cost_ignored property - for such a high value it looks like 99.9% of the execution plan was simply ignore, or maybe I am still not understanding well those values.
Extended Event batch_mode_scan_on_rowstore
There is another Extended Event in the current release of SQL Server 2019 CTP 2.0 - the batch_mode_scan_on_rowstore, which allows us to account the tables that were scanned with the Batch Execution Mode.
The properties of this of this property is presented below:
- db_id - Request db id.
- table_id - Request table id.
- index_id - Request index id.
- is_batch_population_pushed - Is batch population pushed to the storage engine?
Let us dive into a concrete example: consider the following query that joins 6 tables together - this is the very same query that i have used to show the N-ary join, the TPCH Query 5:
SELECT N_NAME, SUM(L_EXTENDEDPRICE*(1-L_DISCOUNT)) AS REVENUE
FROM CUSTOMER, ORDERS, LINEITEM, SUPPLIER, NATION, REGION
WHERE C_CUSTKEY = O_CUSTKEY AND L_ORDERKEY = O_ORDERKEY AND L_SUPPKEY = S_SUPPKEY
AND C_NATIONKEY = S_NATIONKEY AND S_NATIONKEY = N_NATIONKEY AND N_REGIONKEY = R_REGIONKEY
AND R_NAME = 'ASIA' AND O_ORDERDATE >= '1994-01-01'
AND O_ORDERDATE < DATEADD(YY, 1, cast('1994-01-01' as date))
GROUP BY N_NAME
ORDER BY REVENUE DESC;
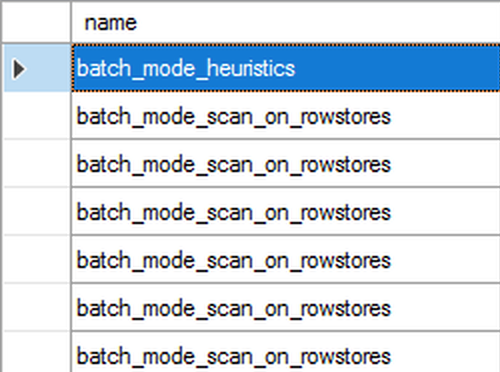
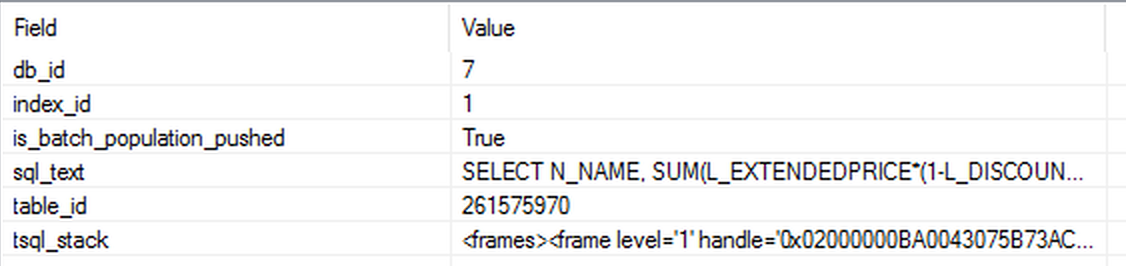 First you can see that we have a batch_mode_heuristics event taking places, followed by precisely 6 times the extended event batch_mode_scan_on_rowstore, that will correspond each of the tables in our join. Opening the details of each of the event, will reveal the respective database id, index id and the object id, which are easy to decode into the textual representation to understand under which table & index does this event took place.
Especially when debugging a complex query, where currently we have no tools supporting an easy filtering of the Batch Mode in SSMS, this can be some of the easier way to achieve this task. Actually in one of the upcoming blog post, there will be a very good need to demonstrate some limitations of the current implementation of the Batch Execution Mode on the Rowstore Indexes, specifically with the help of this very Extended event - batch_mode_scan_on_rowstore.
Final Thoughts
While we are in the early stages of the CTP for the SQL Server 2019, I already love the level of the details and the insight we are getting into how the decision for the Batch Execution Mode works.
I guess as we shall be approaching the RTM (the final release) there will be some changes and bug-fixes, but it is hugely exciting road that Microsoft is taking us, the SQL Server users. I can not imagine the creation of the Extended event batch_mode_heuristics even a couple of years ago, but lately we are keep getting served with a high quality and good understandability releases and tools.
There so many things to improve and explain in those properties, such as - it looks that the last_optimization_level property stays pretty constantly on -1 which probably means that it is not implemented yet, and it is a pity - it could give us reasons for queries not getting Batch Mode as for example because of not going to full optimisation level,
but I am staying very much tuned in discovering what are the changes that we shall see before the RTM and even in the postcoming Cumulative Updates.
to be continued with Batch Mode – part 4 ("Some of the limitations")