Continuation from the previous 59 parts, the whole series can be found at https://www.nikoport.com/columnstore/.
This blog post is dedicated to some of the major improvements in SQL Server 2016, related to the Batch Execution Mode.
By all means this list is not complete, I have already written about Batch Mode improvements in SQL Server 2016 previously – see Columnstore Indexes – part 59 (“Aggregate Pushdown”), Columnstore Indexes – part 58 (“String Predicate Pushdown”) & of course in Columnstore Indexes – part 54 (“Thoughts on upcoming improvements in SQL Server 2016”).
I have decided to select a number of features to describe in this blog post, namely:
– Single Core Batch Execution Mode Support
– Sort Operator Support
– Multiple Distinct Count
leaving one of the very key improvement for the next blog post :)
Batch Mode with 1 core
As I have already suspected and discovered in December of 2014, the current Azure offering has offered support for a Single Core Batch Execution Mode support already, and now with upcoming SQL Server 2016, we have an official & public confirmation that Microsoft will be supporting Batch Execution Mode for a single core.
This is one of the major and most long-awaited items on any Columnstore Index specialist list. This means much better predictability of the query execution times on the real servers, that are being suffering with the lack of memory, since as everyone should know, memory pressure lowers the available degree of parallelism.
I took my copy of the free database ContosoRetailDW and executed the following script to restore a fresh copy:
USE master;

alter database ContosoRetailDW
    set SINGLE_USER WITH ROLLBACK IMMEDIATE;

RESTORE DATABASE [ContosoRetailDW]
    FROM  DISK = N'C:\Install\ContosoRetailDW.bak' WITH  FILE = 1,
        MOVE N'ContosoRetailDW2.0' TO N'C:\Data\ContosoRetailDW.mdf',
        MOVE N'ContosoRetailDW2.0_log' TO N'C:\Data\ContosoRetailDW.ldf',
        NOUNLOAD,  STATS = 5;

alter database ContosoRetailDW
    set MULTI_USER;
GO

GO
ALTER DATABASE [ContosoRetailDW] SET COMPATIBILITY_LEVEL = 130
GO
ALTER DATABASE [ContosoRetailDW] MODIFY FILE ( NAME = N'ContosoRetailDW2.0', SIZE = 2000000KB , FILEGROWTH = 128000KB )
GO
ALTER DATABASE [ContosoRetailDW] MODIFY FILE ( NAME = N'ContosoRetailDW2.0_log', SIZE = 400000KB , FILEGROWTH = 256000KB )
GO

ALTER TABLE dbo.[FactOnlineSales] DROP CONSTRAINT [PK_FactOnlineSales_SalesKey];

create clustered columnstore Index PK_FactOnlineSales
	on dbo.FactOnlineSales;
For testing in this case I have chosen a SQL Server 2016 CTP 2.0, since CTP 2.1 has some major regressions in the are of Batch Execution Mode.
I have decided to run 3 versions of my test query forcing the following options:
– Batch Execution Mode with 2 Cores
– Batch Execution Mode with 1 Core
– Row Execution Mode with 1 Core
set statistics time, io on

-- MAXDOP = 2, Batch Mode
select sales.StoreKey, prod.ProductLabel, sum(SalesAmount)
	from dbo.FactOnlineSales sales
		inner join dbo.DimProduct prod
			on sales.ProductKey = prod.ProductKey
	where sales.UnitCost > 10
	group by sales.StoreKey,  prod.ProductLabel
	option (maxdop 2);

-- MAXDOP = 1, Batch Mode
select sales.StoreKey, prod.ProductLabel, sum(SalesAmount)
	from dbo.FactOnlineSales sales
		inner join dbo.DimProduct prod
			on sales.ProductKey = prod.ProductKey
	where sales.UnitCost > 10
	group by sales.StoreKey,  prod.ProductLabel
	option (maxdop 1);

-- MAXDOP = 1, Row Execution Mode
select sales.StoreKey, prod.ProductLabel, sum(SalesAmount)
	from dbo.FactOnlineSales sales
		inner join dbo.DimProduct prod
			on sales.ProductKey = prod.ProductKey
	where sales.UnitCost > 10
	group by sales.StoreKey,  prod.ProductLabel
	option (maxdop 1, querytraceon 9453 );
Here are the respective execution plans in the order of the executed queries:
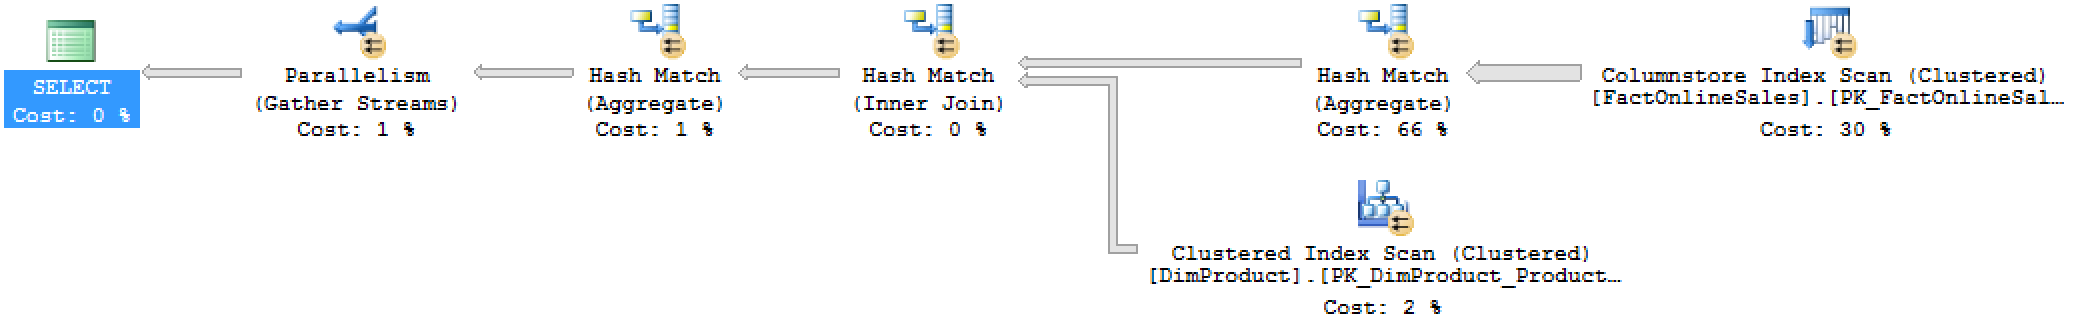
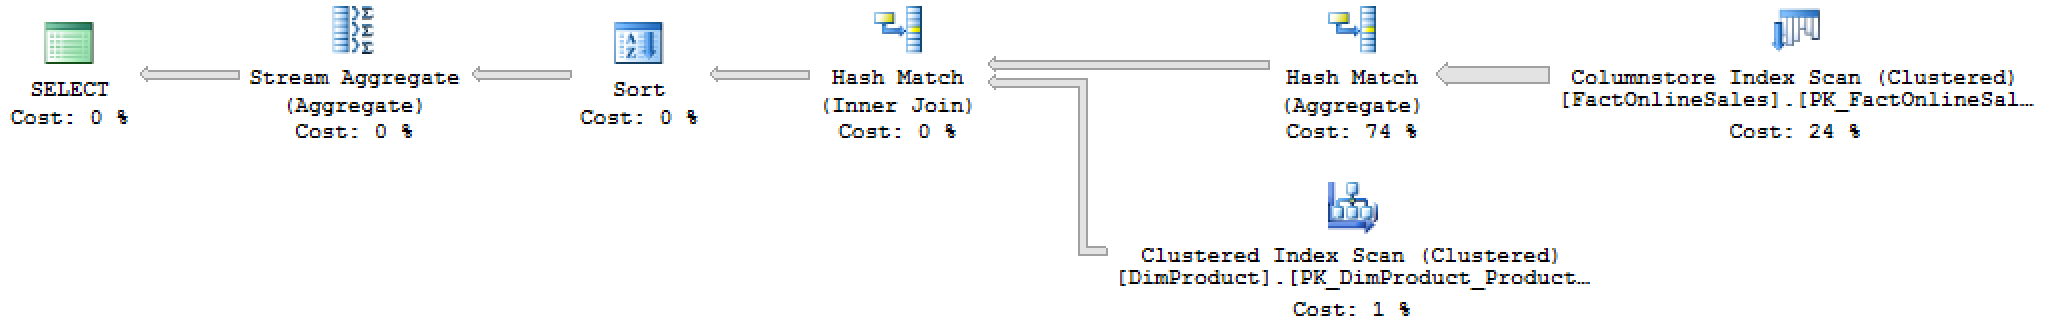
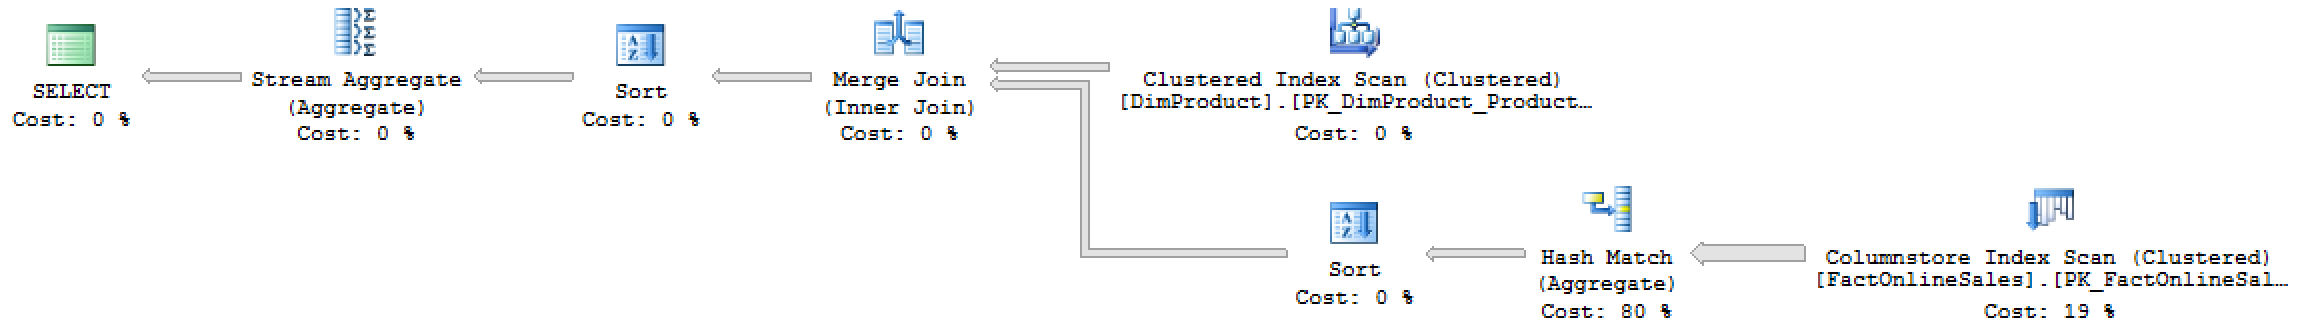
You should easily see the differences between the plans, with Row Execution Mode going for the Merge Join and naturally sorting the Hash Match output in order to get less resources consumed – the difference in memory grants is quite impressive.
The Row Execution Mode manages to beat Batch Execution on the memory consumption, but if we talk about speed improvements, then Batch Execution Mode can run circles around similar queries of Row Execution Mode. :)
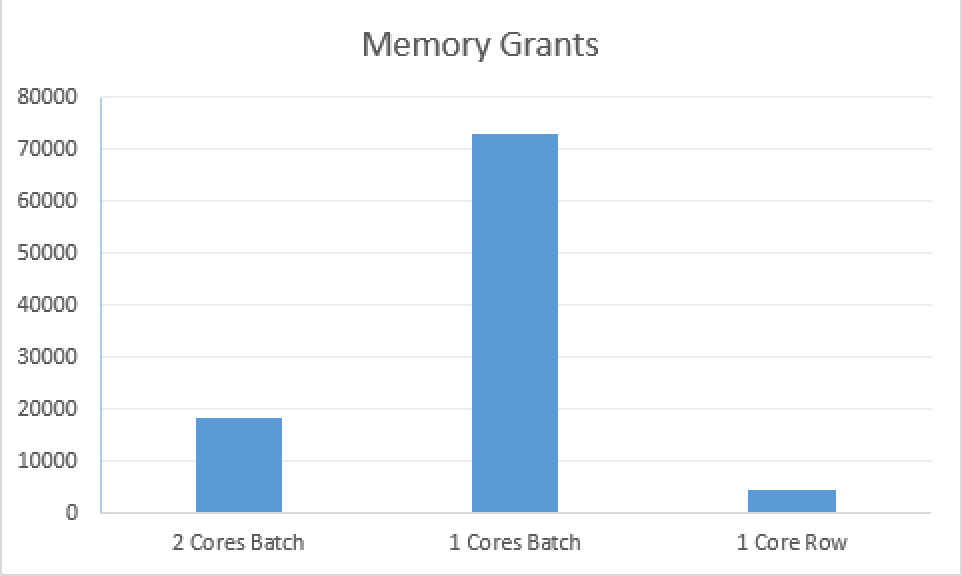 Looking at the results of the Memory Grants, I can’t stop wondering if there are some miscalculations for the Batch Mode involving 1 core. I imagine that right now it is more a kind of a “playing safe” mode, since we are still quite deep into the beta-versions of software, but still we are talking about 4 times bigger memory grant for a query, that uses just 2 times less cores.
I hope the memory consumption will get improved in the further versions of SQL Server 2016 before RTM, I have seen a number of troubles with the Memory Spill’s for a single core, and so I can imagine that higher memory consumption is a kind of safe haven for getting almost guaranteed performance, but we all know that having a lot of big memory-hungry queries leads resource semaphore to suspend them quite fast, which is definitely is an opposite of what we are hoping to achieve.
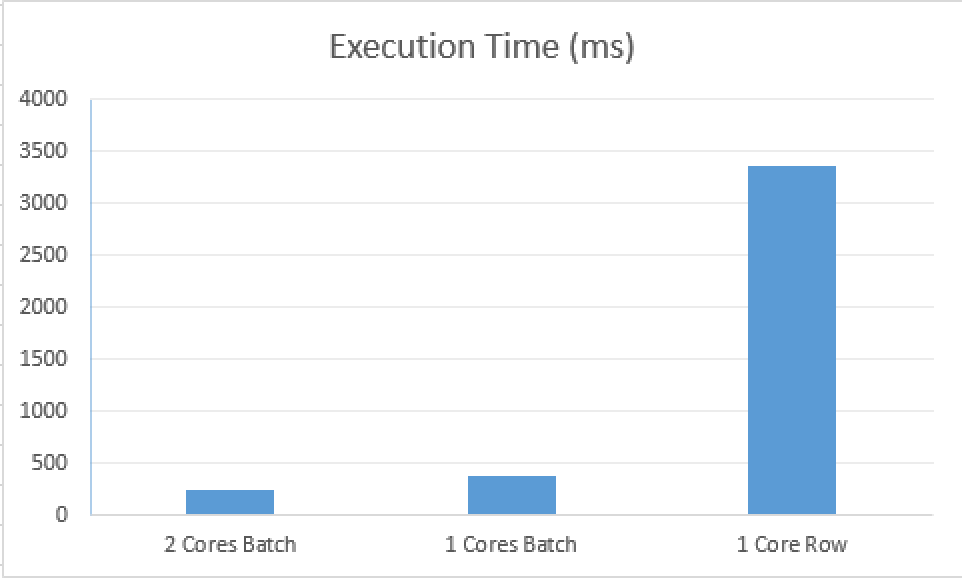
But let’s take a look at the execution times, and here are my results:
1. CPU time =  281 ms,  elapsed time =  242 ms.
2. CPU time =  281 ms,  elapsed time =  385 ms.
3. CPU time = 3203 ms,  elapsed time = 3365 ms.
 I have shown enough times in my presentations the difference between having Batch Execution Mode and having Row Execution Mode for Columnstore Indexes, and this is one more examples that shows that the true difference lies exactly in the way that the data is being processed.
One would expect some Row Execution Mode to finish in under 1 second, but as a matter of a fact it takes almost 10 times more than the equal (1 core) Batch Execution Mode.
As for the difference between the execution times of the 2 cores vs 1 core Batch Execution Mode, here we clearly deal with the percentage of time improvement that was spent in the Batch Mode.
Single Core Batch Execution Mode is a very important improvement for the Columnstore Indexes, especially for the Operational Analytics it will make a huge impact, but there are definitively things to improve before the final release of SQL Server 2016.
Sort Operator Support
One of the key operators that was not supporting Batch Mode in SQL Server 2014 was the Sort, and in SQL Server 2016 Microsoft team has finally implemented some support for it.
Let’s run a simple test query, forcing ordering with the help of the Order By statement:
declare @loadDate as DateTime;

select @loadDate = sales.loadDate
	from dbo.FactOnlineSales sales
		inner join dbo.DimPromotion prom
			on sales.PromotionKey = prom.PromotionKey
	where prom.DiscountPercent = 0
	order by sales.LoadDate;
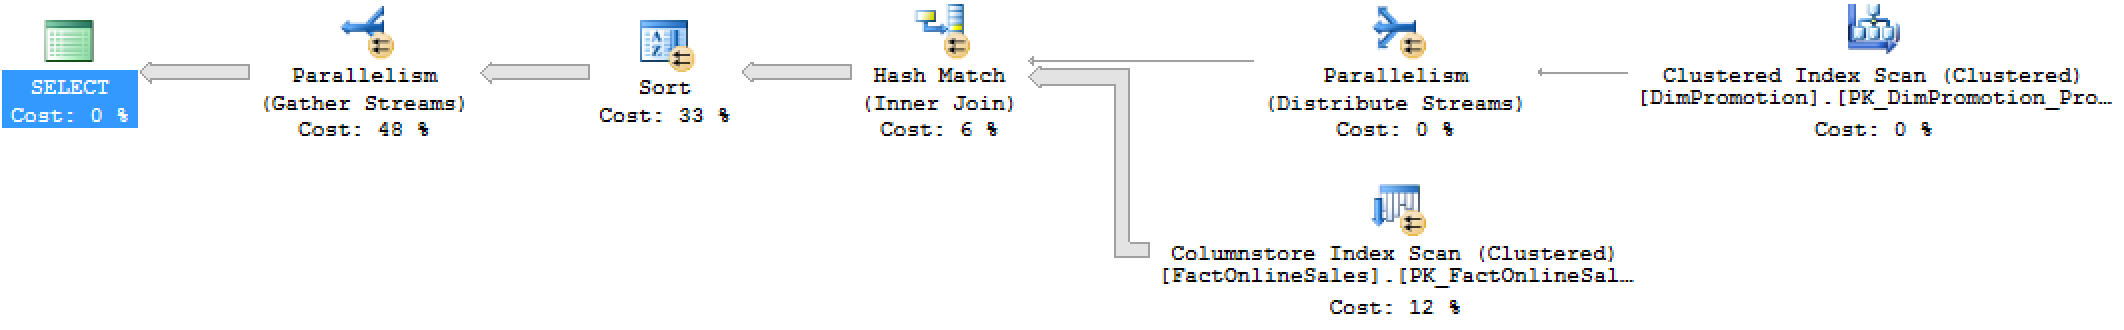
 Looking at the execution plan you will notice the presence of the Sort operator in it. And consulting Sort properties will reveal that it was successfully executed in the Batch Execution Mode. This is the way that we are getting such an incredible improvement that in this case in comparison to SQL Server 2014 ~9.5 times improvement brings, as you can see from the results below:
1. (Batch Mode): CPU time =  406 ms,  elapsed time = 203 ms.
2. (Row Mode)  : CPU time = 2344 ms,  elapsed time = 1895 ms.
Well, after good news, there are limitations in the current versions, of course…
Should we include a TOP X into our T-SQL statement, where X is below some certain percentage, then we are getting our SORT operator back into the Row Execution Mode.
I can only conclude from my tests that it has to do with TempDB spilling or simply having way too few rows where Batch Mode would not bring any improvement at all (sorting 5 rows for example does not make sense to do in Batch Execution Mode).
Take a look at the following test query:
declare @loadDate as DateTime;

select top 450000 @loadDate = sales.loadDate
	from dbo.FactOnlineSales sales
		inner join dbo.DimPromotion prom
			on sales.PromotionKey = prom.PromotionKey
	where prom.DiscountPercent = 0
	order by sales.LoadDate
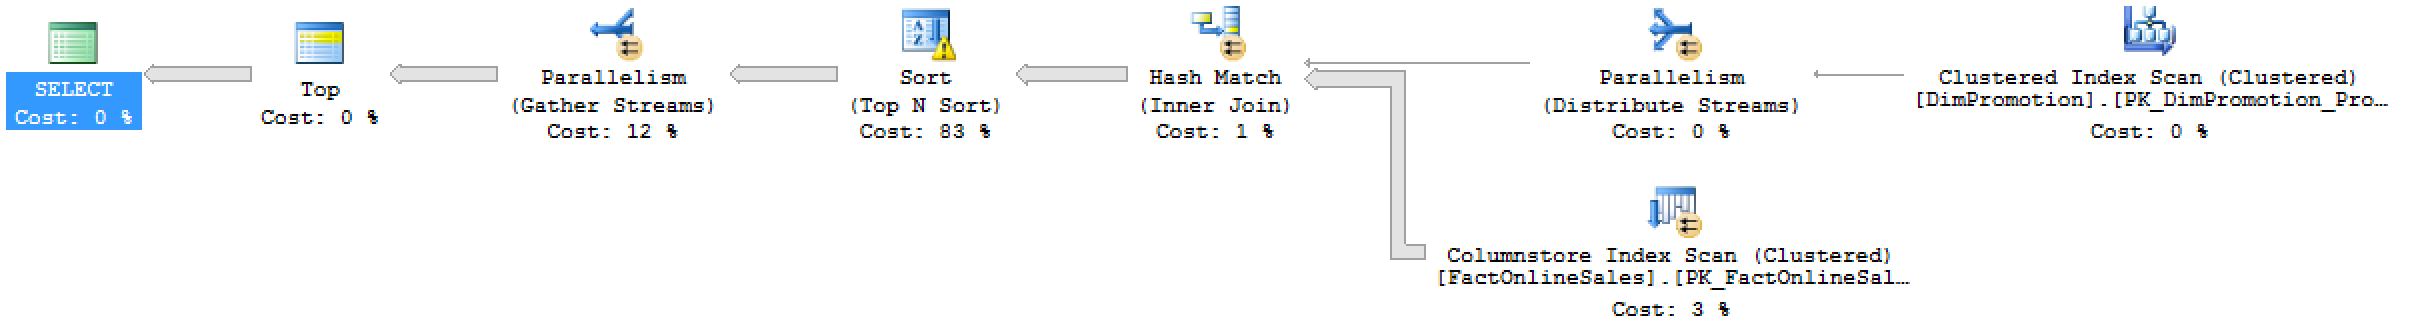
You can see from the execution plan above that our SORT operator has spilled into TEMPDB because of not having enough resources. This has pushed our SORT operator into Row Execution Mode.
I can only hope that Spilling into TempDB while sorting data will receive Batch Execution Mode improvement, we have received Hash Table Spill support for Batch Execution Mode in SQL Server 2014 and this implementation for Sorting should not be anywhere near impossible.
Multiple Distinct Count
A very common query for an analytical queries is to have multiple distinct count operations within a single query. In SQL Server 2012 & SQL Server 2014 those types of queries were painfully slow, because of the issues in the implemented execution plan – no one likes to see Eager Spools if they are not truly necessary.
Let’s run the following test query on the SQL Server 2016 CTP 2.1 & on SQL Server 2014 SP1, to see if there is some measurable difference in the actual performance.
set statistics time on;

select prom.PromotionName,
	   count( distinct StoreKey ) as 'Distinct Stores',
  	   count( distinct CurrencyKey ) as 'Distinct Currencies',
	   count( distinct ProductKey ) as 'Distinct Products'
	from dbo.FactOnlineSales sales
		inner join dbo.DimPromotion prom
			on sales.PromotionKey = prom.PromotionKey
	where prom.DiscountPercent = 0
	group by prom.PromotionName
Take a look at the results below, I do not think that any additional description here would be necessary. We are talking over 100 times overall improvements with well over 100 times improvement in the spent CPU resources:
1. SQL Server 2016:   CPU time =    94 ms,  elapsed time =   113 ms.
2. SQL Server 2014:   CPU time = 14218 ms,  elapsed time = 13483 ms.
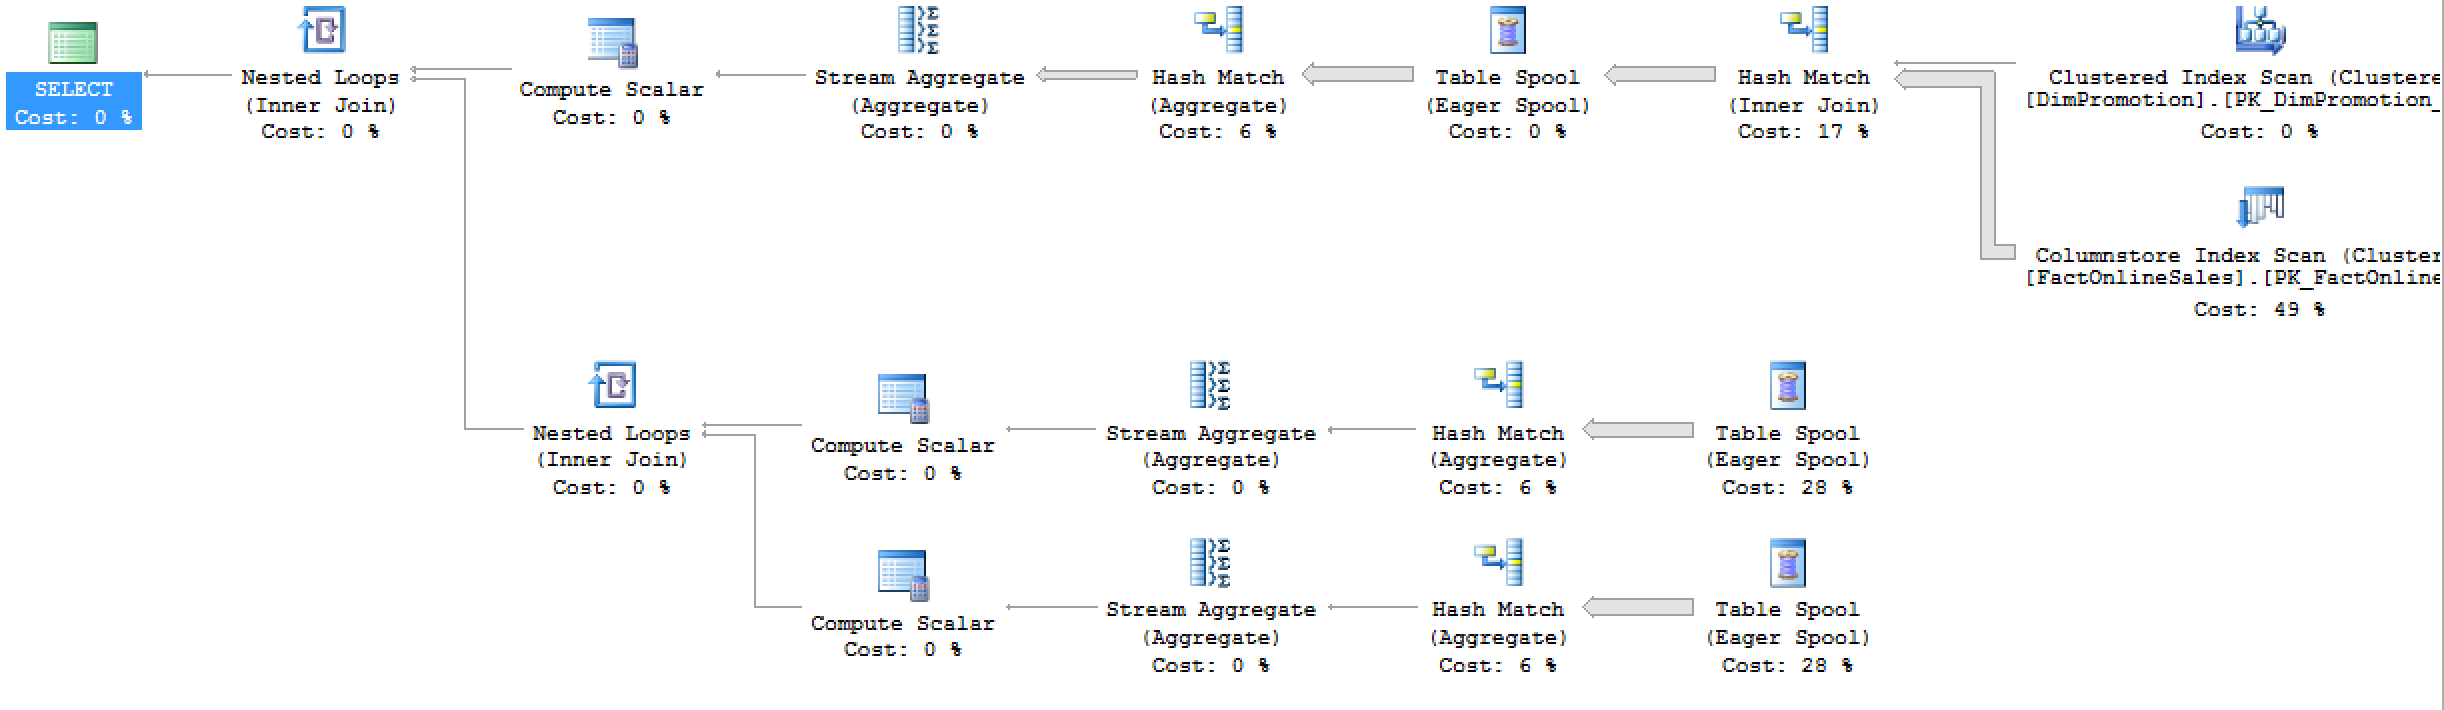
Take a look for yourself, the differences in the execution plan are truly impressive (and notice that the 2014 execution plan is not complete, that is just a partial reproduction):
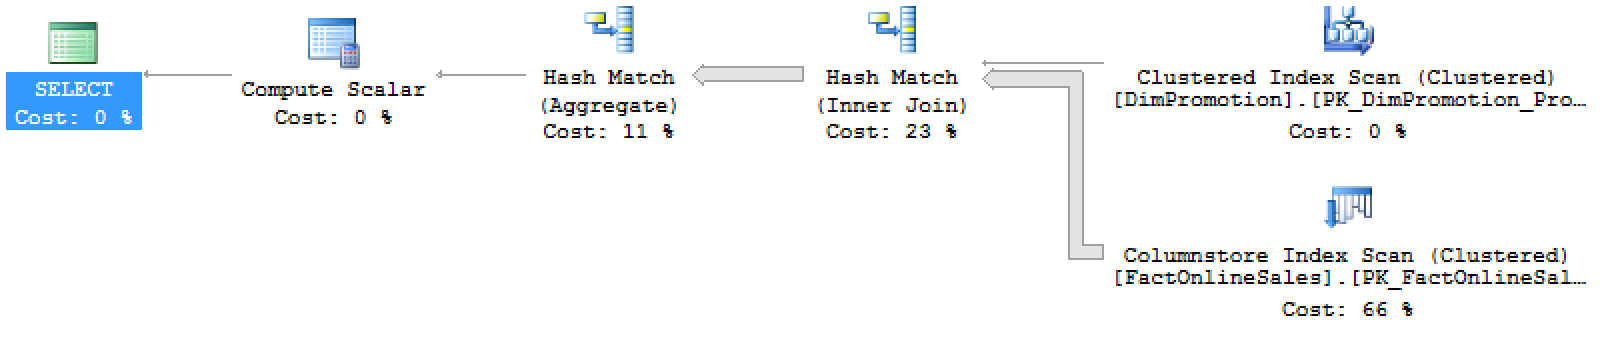
The implementation in SQL Server 2016 is quite simple, simply hashing the received information and determining count of distinct values directly without resorting to expensive temporary storage in order to scan that temporary storage multiple times.
I am confident that a lot of people shall benefit this feature and looking back at SQL Server 2014 & 2012 people will wonder about the reasons that prevented this feature to be implemented right away in SQL Server 2012.
I imagine this simply has to do with the resources and time that the development team has, and the fact that we are getting improved versions of Columnstore Indexes & Batch Execution Mode proves that the problem is not with the capability but with capacity.
Well, that’s perfect, you might say … But are there any gotchas ?
Sure thing, just run this query, which does not contain any GROUP BY at all:
select     count( distinct StoreKey ) as 'Distinct Stores',
  	   count( distinct CurrencyKey ) as 'Distinct Currencies',
	   count( distinct ProductKey ) as 'Distinct Products'
	from dbo.FactOnlineSales sales
		inner join dbo.DimPromotion prom
			on sales.PromotionKey = prom.PromotionKey
	where prom.DiscountPercent = 0
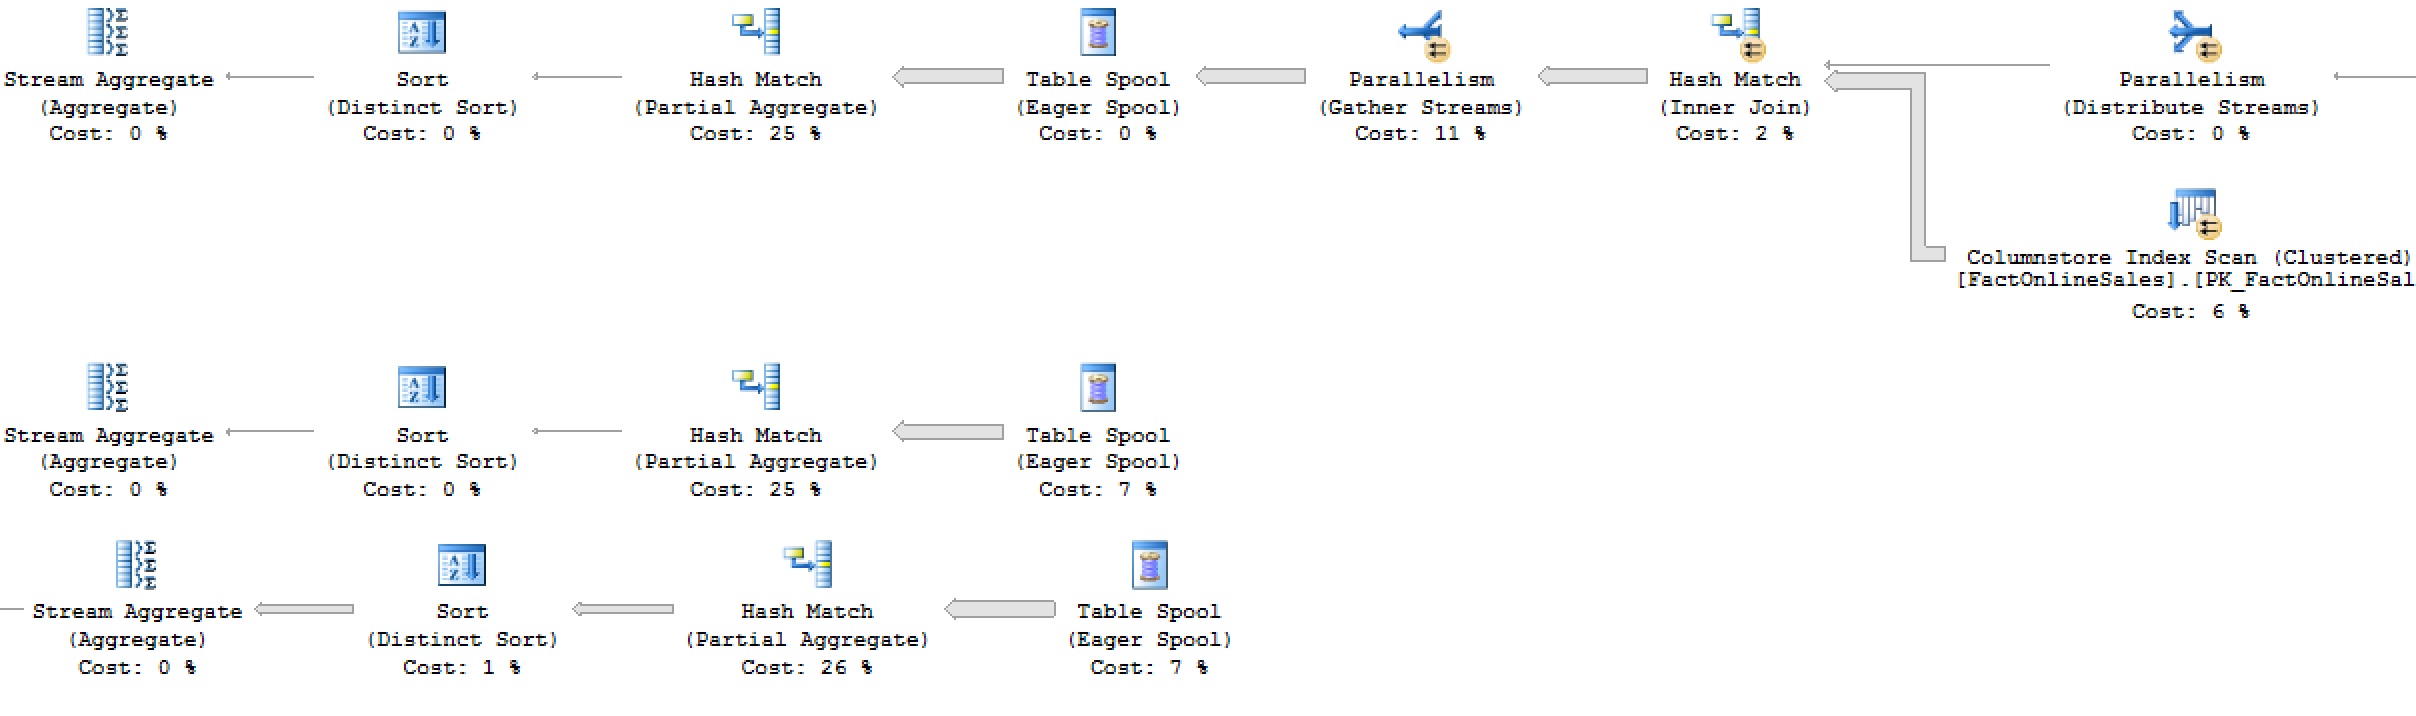
I hope you will got a cup of coffee before running that query, here is the execution plan for it, take a look at it to see if you notice something strange and compare it with the original Multiple Distinct Count in SQL Server 2016:
Eager spools ? Check. :(
Multiple execution trees ? Check. :(
SQL Server 2014 distinct count style ? Check :(
Slower execution times in SQL Server 2016 than in SQL Server 2014 SP1 ? Check :(
1. SQL Server 2016:   CPU time = 11125 ms,  elapsed time = 11253 ms.
2. SQL Server 2014:   CPU time = 10374 ms,  elapsed time =  9772 ms.
Let me assure you that Microsoft knows about this missing functionality and I really hope that they will fix it before RTM.
Overall some great improvements for the Batch Execution Mode, with some very useful improvements but also some important bugs to fix.
From my point of view, there are no reasons to stress about the bugs, since this test is still based on a very early preview version of the software.
In the next blog post I will focus on another important Batch Mode improvement, that definitely deserves its own space. :)
to be continued with Columnstore Indexes – part 61 (“Window aggregate functions”)
Seems that the limitation of having a GROUP BY in a multiple COUNT DISTINCT query has been lifted in RTM (or at least in SP1).
However, it seems that taking a COUNT DISTINCT over a BIT field causes the query optimizer to use table spools. The way around this is to cast the BIT field to INT and then take COUNT DISTINCT
Hi Markus,
yeap. There are constant changes and improvements and I simply can’t keep up updating every single blog post.
Thank you for pointing that this feature was improved. To my memory it was already in the RC branch.
Regarding COUNT DISTINCT over a BIT field – I guess that this functionality is simply not implemented by the engine, but given that the solution (casting or changing data type) is so easy in the most cases – this is not a priority right now.
By the way, given effectiveness of the Columnstore compression I am actually thinking if there will be really some difference of storing 0 & 1 in BIT vs TinyINT. I expect them to be equally big.
Best regards,
Niko