Continuation from the previous 49 parts, starting from https://www.nikoport.com/2013/07/05/clustered-columnstore-indexes-part-1-intro/
This blogpost is focused on the reading part of the IO subsystem of the Columnstore Indexes. I will try to explain the improvements in the reading process as well as some of the differences to the traditional Row Storage.
The key performance point of reading part of the Columnstore Indexes is the read-ahead mechanism of SQL Server. When SQL Server (Enterprise Edition) is performing a sequential scan on a table with significant amount of data, the storage engine is trying to improve the performance by issuing read-ahead calls that will ensure that once CPU is ready to process the information, it is already pre-fetched into the memory and hence ready to be worked on.
The read-ahead will try to acquire up to 500 database pages ahead of the performed scan, while combining up to 64 contiguous pages into a single read. This all means that in practice SQL Server is capable to acquire from 8KB and up to 512KB of information in 1 single read while performing read-ahead operation.
This information is correct for the traditional Row Store, and the limitation makes a lot of sense, but since Columnstore Indexes introduction in SQL Server 2012 there is a very significant change to that information.
As you should know, Columnstore Indexes are compressed with a number of different algorithms with the final layers being compressed with the xVelocity (also known as a Vertipaq), with compressed binary data being stored on the disk contagiously.
Additionally, since compressed data is never updated (all new bits are inserted into the new Delta-Stores which might or not become compressed segments), there is a guarantee that the compressed Segments will never be modified.
This architecture gives an enormous advantage for any read-ahead operations for Columnstore Indexes which is naturally well used inside the SQLOS – the read-ahead limit for Columnstore Indexes is actually 16 times bigger than for the RowStore structures: a single read-ahead for Columnstore Indexes can acquire up to 8MB of data.
This is an improvement of a very significat scale – 16 times more data can be prepared for the CPU, which at the same time can process the Columnstore Index information at a higher speed, if we are able to get Batch Processing Mode for our Columnstore Index Scan operation.
 For the demo part, this time I decided to go into different direction (because this is a post number 50 in the series, haha :)) and take some of the Stack Exchange data, Stack Exchange Data Dump to be more precise.
For the details on the download and the data import please visit Brent Ozar’s blogpost on how to query StackOverflow.com.
Basically after downloading the dumps, you will need to use the StackOverflow Data Dump Importer, developed by Jeremiah Peschka.
For the test, I have chosen to query PostHistory.Comments table, which in my case contains over 36+ Million Rows and 5 columns: 36.585.420 rows to be more precise. :) To test the reading capacity of Columnstore Indexes, I have decided to create a a slightly modified copy of the original table, calling it PostHistory.Comments_CCI_Modified using the following script, loading the data into a table with Clustered Columnstore Index, this way lowering the total time, since less information was written on the disk (Writes happen only after compression and my TempDB is on quite fast SSD drive).
CREATE TABLE [PostHistory].[Comments_CCI_Modified](
	[Id] [INT] NOT NULL,
	[CreationDate] [DATETIME] NOT NULL,
	[PostId] [INT] NOT NULL,
	[Score] [INT] NULL,
	[UserId] [INT] NULL
);

CREATE CLUSTERED COLUMNSTORE INDEX CCI_Comments_Modified
	ON [PostHistory].[Comments_CCI_Modified;

INSERT into [PostHistory].[Comments_CCI_Modified]
	SELECT Id, CreationDate, PostId, Score, UserId
		FROM [PostHistory].[Comments];
Before advancing any further, I have also created a slightly modified version of the Comments table, which is compressed with the PAGE compression:
CREATE TABLE [PostHistory].[Comments_Modified](
	[Id] [INT] NOT NULL PRIMARY KEY,
	[CreationDate] [DATETIME] NOT NULL,
	[PostId] [INT] NOT NULL,
	[Score] [INT] NULL,
	[UserId] [INT] NULL
) WITH (DATA_COMPRESSION = PAGE);

INSERT into [PostHistory].[Comments_Modified]
	SELECT Id, CreationDate, PostId, Score, UserId
		FROM [PostHistory].[Comments_CCI_Modified];
To make sure that I am not inventing anything, I have checked on the fragmentation level of my Rowstore table, which in my case was ~4%, the number that should not prevent the major part of the prefetch process on the Rowstore table.
You know the significant difference that we are expecting from the Columnstore compression – let’s check on it:
EXEC sp_spaceused 'PostHistory.Comments_CCI_Modified';
EXEC sp_spaceused 'PostHistory.Comments_Modified';
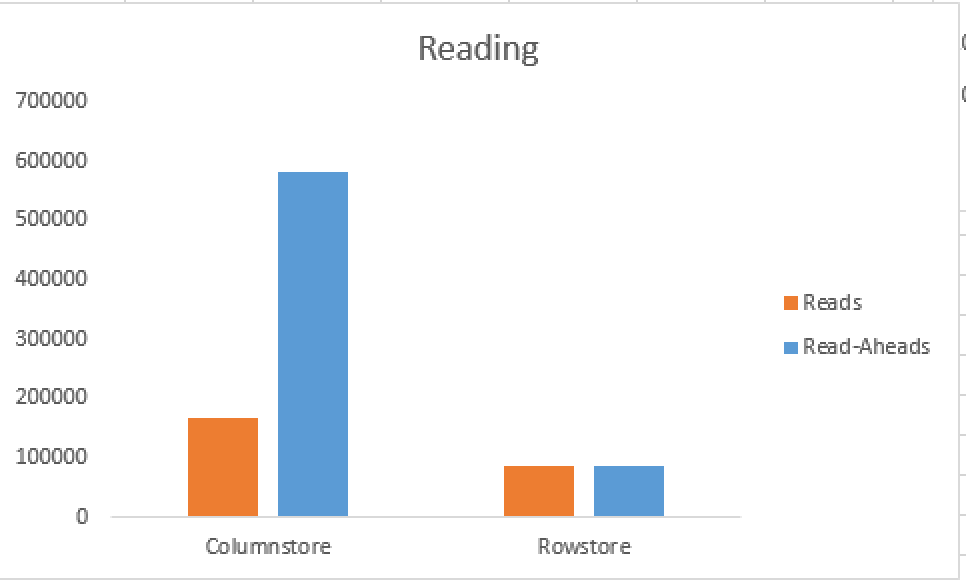
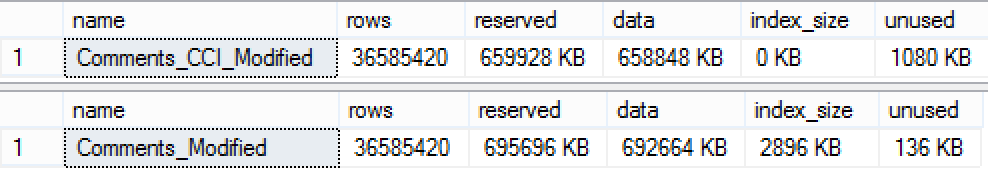 Do you see the difference? If not, then consider the image on the right side, I created a bar graph for better understanding and visualisation.
 What? They look way too similar? Indeed they are! This happens because some of the data inside them is not getting compressed by the current implementation of Columnstore Technology in SQL Server. To be honest for this exercise this is the very best situation of all possible – because both Columnstore & Rowstore Indexes are of similar size, their scan should perform in a similar , comparable way, producing similar execution times, should their prefetching capabilities be similar.
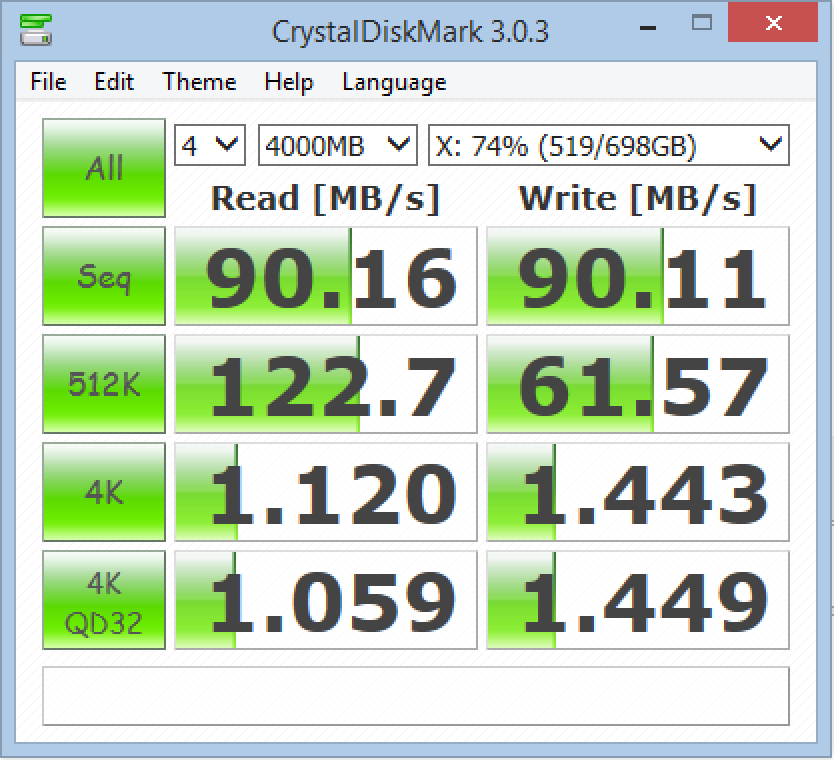 A couple of words about the drive I have chosen – this is a slow drive. How slow it is you can see on the accompanying image of the right side – I have used CrystalDiskMark 3.0.3 to get the results for the sequential reads (90 MB/s) and for 4K reads (1.120 MB/s).
I bet that if you run this on your local drive you will get some better results (haha), but in my case I wanted to take something slow and to measure the difference between RowStore & Columnstore reads, because in the real world you will be reading large GB or TB of data and not just a couple Gigabytes like I do in this demo.
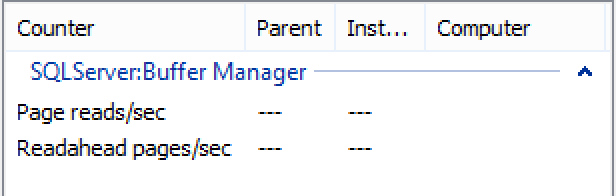 For monitoring the behaviour of the read-ahead, I have started the Performance Monitor, adding 2 of the key metrics from the SQLServer: Buffer Manager counter – Page reads/sec and Readahead pages/sec.
Observing and comparing both of the above specified metrics should lead me onto better understanding of the read-ahead behaviour for both Columnstore & Rowstore Indexes.
Now all I need to do, is to reset my Buffer Pool (with the command DBCC DropCleanBuffers) and run the command which will effectively scan the whole tables. Notice that I have included the the information on the statistics io and time, plus I am definitely taking a look at the actual execution plans for both of my queries, making sure that they did scan whole table with ~36.5 Million Rows:
SET STATISTICS IO, TIME ON

DECLARE @id AS INT,
	@CreationDate AS DATETIME,
	@PostId AS INT,
	@Score AS INT,
	@UserId AS INT;

DBCC DROPCLEANBUFFERS;

SELECT @id = id,
	@CreationDate = [CreationDate],
	@PostId = PostId,
	@Score = Score,
	@UserId = UserID
	FROM PostHistory.Comments_CCI_Modified;

DBCC DROPCLEANBUFFERS;

SELECT @id = id,
	@CreationDate = [CreationDate],
	@PostId = PostId,
	@Score = Score,
	@UserId = UserID
	FROM PostHistory.Comments_Modified;
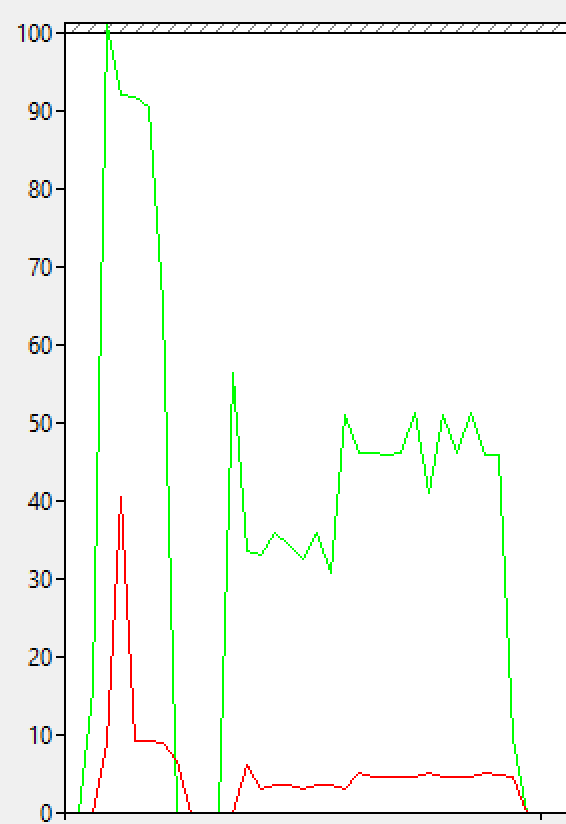 On the left, you will see the picture that is thousand words worth – the first query reading (red) and read-ahead(green) performance compared.
I don’t even care much about exact read-ahead numbers at this point, because 2 similar sized structures reading took different amounts of time.
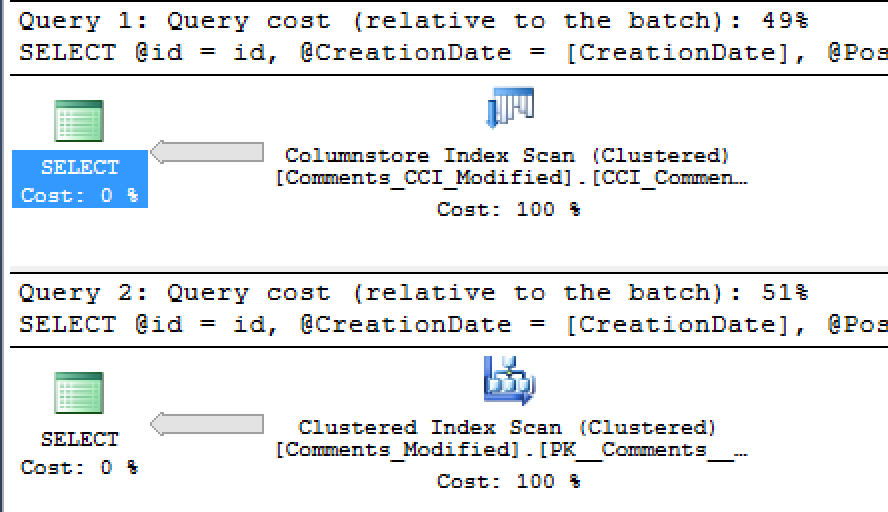 Let’s check on the actual execution plans, maybe something went wrong down there: as you can see on the right image the actual execution plans are similiar, we are simply scanning the whole table, reading the last rows into our variables. Thats it. And if you are laughing this lines pointing at the Batch Execution mode, than you are badly wrong, since to all my tests the actual execution mode had no actual influence on the reading IO or the read-ahead prefetching.
The real difference in the execution times or IO is not about those 2% that the execution plans are showing. :)
What about Statistics IO & Statistics TIME commands that I have activated for the execution:
SQL Server Execution Times:
   CPU time = 8687 ms,  elapsed time = 12900 ms.

SQL Server Execution Times:
   CPU time = 19235 ms,  elapsed time = 31899 ms.
Table 'Comments_CCI_Modified'. Scan count 1, logical reads 165684, physical reads 32, read-ahead reads 580533, lob logical reads 0, lob physical reads 0, lob read-ahead reads 0.

Table 'Comments_Modified'. Scan count 1, logical reads 86944, physical reads 2, read-ahead reads 86938, lob logical reads 0, lob physical reads 0, lob read-ahead reads 0.
 If we trust the displayed information :), than we naturally start asking serious questions on why would it make any sense on prefetching 600K Data Pages for one data structure while another similar-sized data structure is prefetching less than 87K Data Pages.
The only explanation that I can come with is that whenever we are reading the Columnstore Index Data Pages from the hard drive, we are fetching them into Columnstore Object Pool which is in turn decompresses the real data into the Buffer Pool, and between all those operations the reads are being accumulated plus a couple of bugs … :)
To prove the point, I will use one of the queries from my good friend Glenn Berry from SQLSkills:
-- Check sequential throughput results (MB/sec)
SELECT 8 * (32 + 580533)/12900 AS [ MB/sec Sequential Read Throughput];
Should the read-ahead information be correct, we would be talking about 360 MB/sec reads from this external drive, connected to the USB port of my computer. Nah …
The Rowstore information appears to be more correct – 21 MB/second:
-- Check sequential throughput results (MB/sec)
SELECT 8 * (2 + 86938)/31899 AS [ MB/sec Sequential Read Throughput];
The first step here would be naturally for Microsoft Development Team to show more detailed and separated information in the next version of SQL Server. :)
Conclusions
At the point the best thing to do would be to write a beautiful conclusion about the perfectness of Columnstore Indexes, yeah.
But wait, didn’t I mention that the tested table is a modified version of the Stack Overflow Data Dump? What about the complete one?
Sure thing – I have created and tested it as well. The real difference between the original and the modified version is just 1 field: [Text] AS Nvarchar(700) :)
To prepare this full version, please use the following script:
CREATE TABLE [PostHistory].[Comments_CCI](
	[Id] [INT] NOT NULL,
	[CreationDate] [DATETIME] NOT NULL,
	[PostId] [INT] NOT NULL,
	[Score] [INT] NULL,
	[Text] [NVARCHAR](700) NOT NULL,
	[UserId] [INT] NULL
);

CREATE CLUSTERED COLUMNSTORE INDEX CCI_Comments
	ON [PostHistory].[Comments_CCI];

INSERT into [PostHistory].[Comments_CCI]
	SELECT Id, CreationDate, PostId, Score, [Text], UserId
		FROM [PostHistory].[Comments];
For the Rowstore table the only that was added is the PAGE compression for the primary key:
ALTER TABLE [PostHistory].[Comments] ADD  CONSTRAINT [PK_Comments] PRIMARY KEY CLUSTERED
(
	[Id] ASC
) WITH (DATA_COMPRESSION = PAGE);
To check on the respective table sizes, here are the queries:
EXEC sp_spaceused 'PostHistory.Comments_CCI';
EXEC sp_spaceused 'PostHistory.Comments';
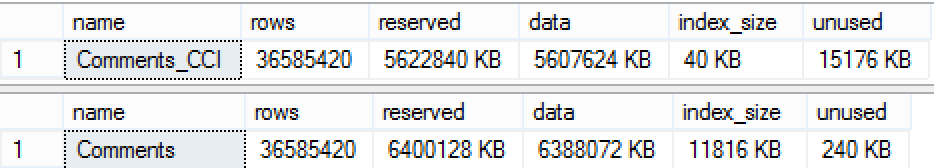 Here we have a clear difference of 5.6GB for the Columnstore Index and ~6.4GB for the RowStore Index. The expectation here are more than clear.
Our test queries are waiting for us:
SET STATISTICS IO, TIME ON

DECLARE @id AS INT,
	@CreationDate AS DATETIME,
	@PostId AS INT,
	@Score AS INT,
	@Text AS Nvarchar(700),
	@UserId AS INT;

DBCC DROPCLEANBUFFERS

SELECT @id = id,
	@CreationDate = [CreationDate],
	@PostId = PostId,
	@Score = Score,
	@Text = [Text],
	@UserId = UserID
	FROM PostHistory.Comments_CCI

DBCC DROPCLEANBUFFERS

SELECT @id = id,
	@CreationDate = [CreationDate],
	@PostId = PostId,
	@Score = Score,
	@Text = [Text],
	@UserId = UserID
	FROM PostHistory.Comments;
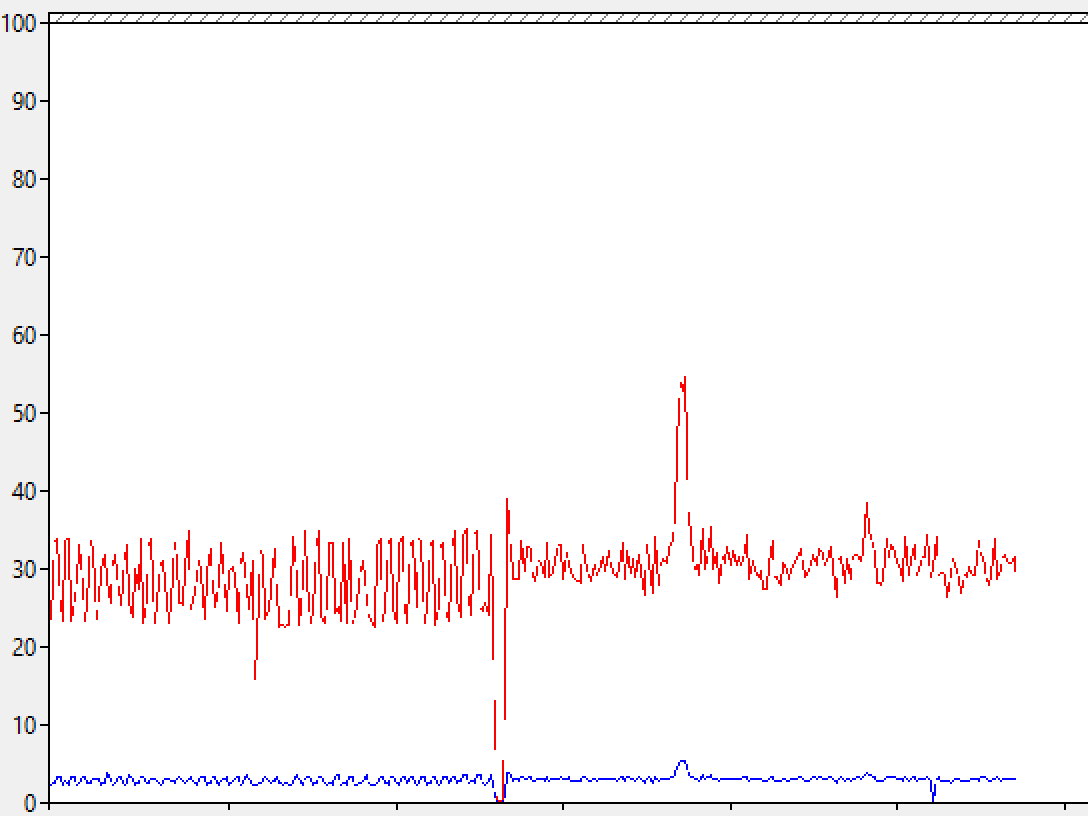 This is an extract of the final part of the first query (Columnstore Index) and the begin of the second query execution (Rowstore Index). In the middle, you can see that the read-aheads drops down (red) as well the the reads (blue), and then after a couple of seconds they jump to some similar/comparable numbers.
So for the Columnstore Table I have obtained the following results from the SET STATISTICS command:
Table 'Comments_CCI'. Scan count 1, logical reads 2072298, physical reads 359, read-ahead reads 3317778, lob logical reads 0, lob physical reads 0, lob read-ahead reads 0.

SQL Server Execution Times:
   CPU time = 69640 ms,  elapsed time = 261031 ms.
Table 'Comments'. Scan count 1, logical reads 799977, physical reads 2, read-ahead reads 799995, lob logical reads 0, lob physical reads 0, lob read-ahead reads 0.

SQL Server Execution Times:
   CPU time = 26953 ms,  elapsed time = 260157 ms.
I will ignore the reads & read-aheads informations and just simply dive into spent time numbers: CPU: ~70 seconds (Columnstore) vs 27 seconds (Rowstore) and the total execution times have a real difference of around 1 second, while the total amount is all about 260 seconds, meaning that the difference for the execution time is around 0,04% :) Yes, that is 0,04% not the 4% :)
What is going on here ? What is the difference, we have just added a potential 1400 bytes (nvarchar(700)) to the table structure and it should improve the situation …
Well, well, well :)
Let’s take a look at the internals of our Columnstore table, comparing the Row Groups between the 2 tested Columnstore Tables:
SELECT OBJECT_NAME(object_id) AS TableName, COUNT(*) AS RowGroups, AVG(total_rows) AS AverageRowCount
	FROM sys.column_store_row_groups
	WHERE object_id IN ( OBJECT_ID('PostHistory.Comments_CCI'), OBJECT_ID('PostHistory.Comments_CCI_Modified'))
	GROUP BY object_id;
 Mamma mia! The number of RowGroups differs in almost 10 times! Looking at the average number of rows per RowGroup I can see a similar difference of almost 10 times! What is going on there ? Why our RowGroups are being so unmercifully cut by the engine ?
What does the sys.column_store_dictionaries DMV says:
SELECT OBJECT_NAME(object_id) AS TableName, AVG(dict.on_disk_size)/1024./1024 AS AvgDictionarySize
	FROM sys.column_store_dictionaries dict
	INNER JOIN sys.partitions part
		ON part.hobt_id = dict.hobt_id AND part.partition_id = dict.partition_id
	WHERE part.object_id IN ( OBJECT_ID('PostHistory.Comments_CCI'), OBJECT_ID('PostHistory.Comments_CCI_Modified'))
	GROUP BY part.object_id;
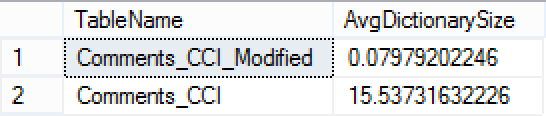 Ladies & Gentlemen, in the case of the FULL Table version (Comments_CCI), we have a dictionary pressure, showing us the effects of wide character columns. :(
If we check on the Row Groups sizes, we might understand better why read-ahead can’t take a good advantage of the
SELECT OBJECT_NAME(object_id) AS TableName, AVG(size_in_bytes)/1024./1024 AS AvgSizeInBytes
	FROM sys.column_store_row_groups
	WHERE object_id IN ( OBJECT_ID('PostHistory.Comments_CCI'), OBJECT_ID('PostHistory.Comments_CCI_Modified'))
	GROUP BY object_id;
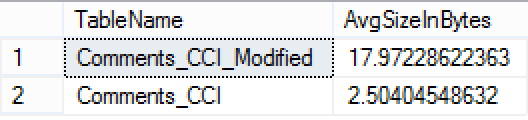 The average size of the Row Group for the Colunstore Tables differs almost 8 times, thanks to the dictionary pressure, and so the read-ahead mechanism can’t take the full advantage of its potential, you can’t read 8MB ahead if the Row group is sized around 2 MB, and I assume since the engine tries to get the maximum number it is incurring an additional resources/time penalty for attempting to access something that does not exist. :)
To arrive to a final conclusion – yes, indeed Columnstore Indexes have an amazing read-ahead capability, but make sure that you are reading the RowGroups that will take the full advantage of this mechanism, and if your Columnstore table is suffering from some kind of pressure (memory or dictionary, for example) than be ready that the reading part will not bring any significant difference, compared to the Row Storage.
to be continued with Clustered Columnstore Indexes – part 51 (“SSIS, DataFlow & Max Buffer Memory”)
For physically contiguous tables both heap and b-tree indexes easily max out any normal hard disk. If you measured something different (and it looks like it) there probably was physical fragmentation. It only takes a 1 page gap to kill a sequential IO and break it into two.
NOLOCK helps on b-trees because it enables allocation order scanning.
The relevant metric is the average fragment size in pages which is available from some DMV. That’s the amount of sequential IO per disk seek that you get. You might be surprised to find it at a lower value than expected.
The fragmentation % number correlates weakly with performance. I don’t even know how it is calculated. If you want fully sequential IO the data *must* be in few fragments.
Hi mark,
thank you for the comment.
If you look at the max size of an individual Segment, than to my understanding this is the natural limit for any prefetching operation.
I believe and I have seen that having a lot of very small Segments for the Columnstore will simply prevent prefetching operation, since the prefetching shall hit the end of the corresponding Segment way too fast.
Even though the engine should go & prefetch other segments in parallel, to my understanding there will be a significant limitation on the overall prefetching performance, because of the additional work that will need to be done (yes, I am speculating here, since I have never seen the source code).
Regarding the Rowstore – once you see the read-ahead reaching 500K, you can be sure that you are doing the max available speed.
I agree with what you have written on the matter of the average fragmentation and the actual breaks in the sequence of the pages. On the top of my head I have never actually investigated or needed this detailed information, is there a query showing the gaps that you can share ?
My attempt with this blog post was to show the difference between Columnstore & RowStore in the implementation and to show at the same time, that even thought the potential of Columnstore read-ahead is much bigger, it does not necessary means that it will function much faster.
Best regards,
Niko
sys.dm_db_index_physical_stats has avg_fragment_size_in_pages. I look at that value a lot and tend to ignore the percentages. Note, that even if the avg_fragment_size_in_pages is 64 which would be equal to 512kb chunks – one seek is 10ms which destroys 1mb of data read yield. So even with 512kb chunks the yield you get from the disk can be like 33%! (Might be higher if the seeks are to very near locations and if SQL Server issues many concurrent IOs so that the hardware can reorder them and run the elevator algorithm).
In fact you seem to have gotten like 1/3 or 1/2 of the maximum sequential speed when scanning the b-tree.
“once you see the read-ahead reaching 500K, you can be sure that you are doing the max available speed.” Given the above I disagree. Although this certainly is a good sign heuristically.
Sequential IO is very brittle in SQL Server. Many things working against you. I hate the product under this aspect. The team seems to not have this on their minds. I have proposed how to solve this but the connect item was simply closed.
Regarding the difference of prefetching for b-tree and columnsstore: For contiguous data I’d expect to find zero throughput differences until you get to IO subsystems that can do GBs/sec (like 2gb/s or 5). Then the IO subsystem might need bigger outstanding requests to saturate the disks and pipes.
But even then the IO subsystem should do read-ahead by itself. I believe even consumer disks do that. Consider that Windows keeps only one 256KB disk IO outstanding at the same time if you copy a big file (verifiable through procmon advanced output). How can the disk provide maximum sequential speed given the tiny 256KB requests? I believe the answer is read-ahead since I have no other plausible answer. All hardware must do read-ahead or suffer terrible sequential perf.
And now you know why consumer disks have 8 or 32MB of on-board cache. For read-ahead (or write-back). It can’t possibly help with real caching because it is too small. The Windows file cache dwarfs that tiny 32mb on-board cache. The disk cache has a hit rate of 0% because all possible hits are served by Windows.
Hi Mark,
thank you for a very valuable comments!
I definitely never invested much in this area, and I might not be able to argue on some of the matters yet.
At the moment of my tests, I have had around 225 for the average fragment size in pages, in order to confirm that my tests are wrong, I have went and rebuilt my table with MAXDOP=1 in order to improve the average fragment size and so right now I have 1767 pages for the value of the average fragment size. Still the graph does not change much if I run my test queries.
Regarding the 500Kb read-ahead, as far as I understand and I believe Bob Ward had even commented this matter on his precon at SQLBits one month ago, the SQLOS is capping the read-ahead to this value, not allowing it to read more even if the hardware is capable of it.
You have mentioned a connect item that was refused, can you please post a link to it ? I would like to learn more on the matter.
Thank you in advance! :)
Best regards,
Niko
Hello Nikko,
if the DMV, sys.dm_db_index_usage_stats reveal high seeks rather than scans for Clustered Column store indexes in SQL Server 2014, do you have an insight in to targeting what causes that? I cannot seem to find corresponding operations that hint on these seek operations against these indexes in the plan cache. Thanks.
Great site BTW!
Hi Rey,
how many rows do you get from the Row Groups typically ?
Best regards,
Niko