Continuation from the previous 31 parts, starting from https://www.nikoport.com/2013/07/05/clustered-columnstore-indexes-part-1-intro/
The Columnstore Row Group Size Question:
What is better for SQL Server performance: to have a big Row Groups (1.045.678 rows) or to have them as small as possible (100.000 rows) or maybe even less ?
Any person I have asked this question said that naturally the ideal size for any given Row Group is the maximum one, because once we are reading a lot of rows, we should be getting the optimum performance out of the better compressed Row Groups. This seems to be about right. In theory. :)
The Answer
This blogpost is about discovering if the most obvious answer on this question is actually the correct one.
First of all, please do not forget that the unit of any reading operation when using Clustered Columnstore Indexes is a Segment (as long as you are processing data from the Segment, in the case of Deleted Bitmap or Delta-Stores the story is pretty much different). It does not matter how many rows you are going to read from the Segment – just 1 row or the 1 Million rows, you are going to read each and every page & extent that are storing your Columnstore Index, which is pretty much expensive.
If you are using a predicate on the non-presorted column and you are needing the not that much data out of the most segments, then you just might be doing quite a big number of unnecessary reads. Of course in the real life you will be doing Segment elimination not only on 1, but on each and every column predicate, but in the case whenever you are working with a Table that contains billions of rows, you might be doing some very serious unnecessary reads.
Oh, I wish Microsoft would give us a chance to control the Row Group Size… Oh yeah, and I have already asked for it since the Nonclustered Columnstore Indexes announcement, a couple of years ago…
Let us kick of with a freshly restored version of the good old & free Contoso Retail DWH database
For the start, we need to remove the Unique Constraints (PK,FKs) from our test table – FactOnlineSales, than creating a Clustered Columnstore Index on it:
ALTER TABLE dbo.[FactOnlineSales] DROP CONSTRAINT [PK_FactOnlineSales_SalesKey];

ALTER TABLE dbo.[FactOnlineSales] DROP CONSTRAINT [FK_FactOnlineSales_DimCurrency];
ALTER TABLE dbo.[FactOnlineSales] DROP CONSTRAINT [FK_FactOnlineSales_DimCustomer];
ALTER TABLE dbo.[FactOnlineSales] DROP CONSTRAINT [FK_FactOnlineSales_DimDate];
ALTER TABLE dbo.[FactOnlineSales] DROP CONSTRAINT [FK_FactOnlineSales_DimProduct];
ALTER TABLE dbo.[FactOnlineSales] DROP CONSTRAINT [FK_FactOnlineSales_DimPromotion];
ALTER TABLE dbo.[FactOnlineSales] DROP CONSTRAINT [FK_FactOnlineSales_DimStore];

-- Next step would be creating a Clustered Columnstore Index on our test table:
create clustered columnstore Index PK_FactOnlineSales
    on dbo.FactOnlineSales;
Now we can create a fast copy of our table:
select *
	into dbo.FactOnlineSales_SmallGroups
	from dbo.FactOnlineSales;
And now, before executing the Clustered Columnstore Indexes creation, lets lower the amount of memory available for the process, thus forcing it to create Row Groups with smaller amounts of rows. In my case I put the maximum server memory on just 222 MB:
NOTE: PLEASE DO NOT EXECUTE THIS ON YOUR SERVER UNLESS YOU KNOW WHAT YOU ARE DOING & RISKING:
exec sp_configure 'max server memory (MB)', '222';
RECONFIGURE WITH OVERRIDE;
GO
Now we are ready to create our Clustered Columnstore Index –Â it might take some time for this query to run:
create clustered columnstore index CCI_FactOnlineSales_SmallGroups
	on dbo.FactOnlineSales_SmallGroups;
Now we can check out what we have actually got, by comparing the sizes of the tables:
exec sp_spaceused '[dbo].[FactOnlineSales]';
exec sp_spaceused '[dbo].[FactOnlineSales_SmallGroups]';
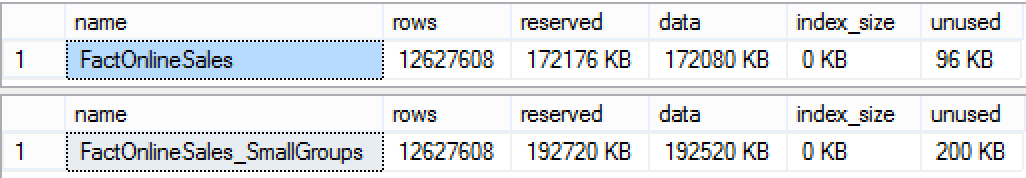 The difference in sizes in our case is not that dramatic – we have 172 MB spent on our original table with the maximum number of rows at the Row Groups (1045678) while the smaller sized Row Groups occupy 192 MB, which means just a 20 MB difference.
Don’t get me wrong on this point, I have seen much bigger differences on the tables with a couple of thousands of Row Groups – and it can get very significant. :)
Now we can check the count of Row Groups for each of our test tables:
SELECT object_name(i.object_id) as TableName, count(*) as RowGroupsCount
	FROM sys.indexes AS i
	INNEr JOIN sys.column_store_row_groups AS rg with(nolock)
		ON i.object_id = rg.object_id
	AND i.index_id = rg.index_id
	WHERE object_name(i.object_id) in ( 'FactOnlineSales','FactOnlineSales_SmallGroups')
	group by object_name(i.object_id)
	ORDER BY object_name(i.object_id);
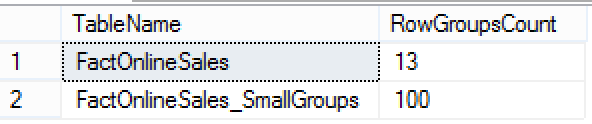
The difference in the number of Row Groups is quite significant – we have 100 Row Groups for one of the tables and just 13 for the other, which is ~8 times less.
The actual maximum number of rows per Row Group for the FactOnlineSales table contains 1045678 rows and for the FactOnlineSales_SmallGroups table is just 131073 rows big.
Now, let us execute to the first test queries:
dbcc freeproccache;
dbcc dropcleanbuffers;
set statistics io on
set statistics time on

select prod.ProductName, sum(sales.SalesAmount)
	from dbo.FactOnlineSales sales
		inner join dbo.DimProduct prod
			on sales.ProductKey = prod.ProductKey
		inner join dbo.DimCurrency cur
			on sales.CurrencyKey = cur.CurrencyKey
		inner join dbo.DimPromotion prom
			on sales.PromotionKey = prom.PromotionKey
	where cur.CurrencyName = 'USD' and prom.EndDate >= '2004-01-01'
	group by prod.ProductName;

dbcc freeproccache;
dbcc dropcleanbuffers;

select prod.ProductName, sum(sales.SalesAmount)
	from dbo.FactOnlineSales_SmallGroups sales
		inner join dbo.DimProduct prod
			on sales.ProductKey = prod.ProductKey
		inner join dbo.DimCurrency cur
			on sales.CurrencyKey = cur.CurrencyKey
		inner join dbo.DimPromotion prom
			on sales.PromotionKey = prom.PromotionKey
	where cur.CurrencyName = 'USD' and prom.EndDate >= '2004-01-01'
	group by prod.ProductName;
I will use the amazing SQL Sentry Plan Explorer tool (you can download free version), which unfortunately does not understand Columnstore Indexes, but hopefully will be fixing this 2 year gap very soon.
Here is the actual execution plan for both of those queries:
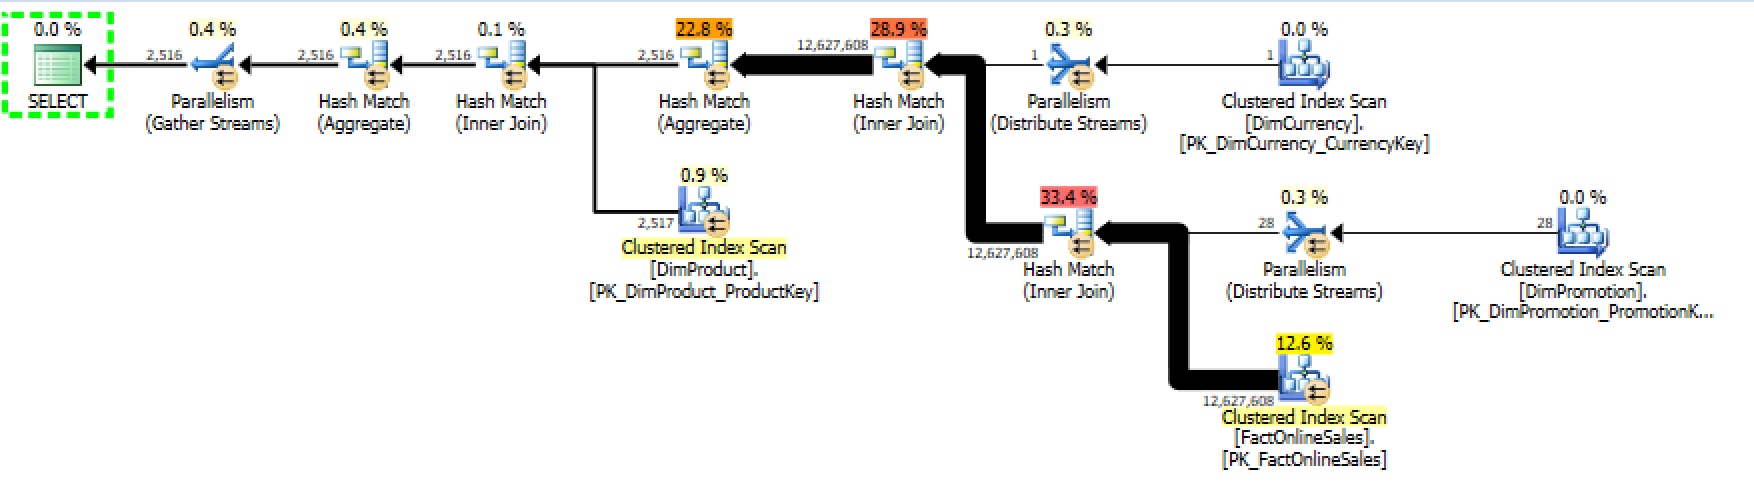
they are equal and it makes sense. Now, we can check out on the some of the execution statistics (Important notice: as far as I understand the Query Plan Explorer simply ignores the read-ahead reads, I have controlled those numbers manually in order not to be fooled):
![]()
Now this is interesting, because according to this information, the first execution plan is slower than the second one – the CPU time is bigger, the duration time is bigger as well, the number of reads is actually much much bigger for the table with smaller number of Row Groups.
Even if we remove statements cleaning out pre-cached information, the final result according to the Execution plan statistics will remain the same.
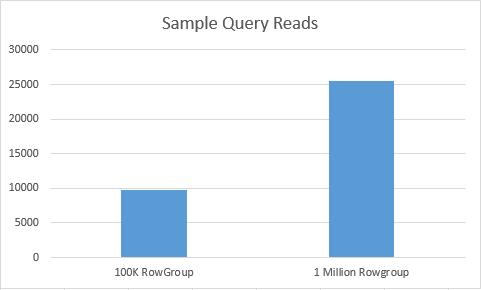 If we look at the Statistics IO, we shall find the the number of the reads (logical as well as the combined – 25460 reads vs 9730 reads) is quite superior in the case of the first table, and while the final execution results might vary significantly, right at the very first attempt we have managed to find the case where having more segments is actually an advantage.
Important Note: I guess that there is some sort of mistake when reporting the reads because there is no such difference in the compared table structures.
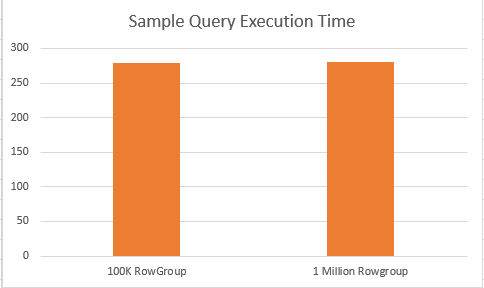 When checking on the execution times, we can see a very slight and insignificant different between execution times – 279 ms for the 100 Rowgroups Table vs 281 ms for the 13 Rowgroups table.
I have executed those queries multiple times in order to make sure that the data is not a simple outlier, and on my test VM the results are very consistent.
Let us try to understand what is going on actually and for that I will use the query for analysing the size of the Columnstore Indexes:
-- Clustered Columnstore Indexes Analysis
SELECT i.name, p.object_id, p.index_id, i.type_desc
   	,sum(p.rows)/count(seg.segment_id) as 'rows'
	,sum(seg.on_disk_size) as 'size in Bytes'
	,cast( sum(seg.on_disk_size) / 1024. / 1024. / 1024 as decimal(8,3)) as 'size in GB'
	,count(distinct seg.segment_id) as 'Segments'
	,count(distinct p.partition_id) as 'Partitions'
	FROM sys.column_store_segments AS seg
		INNER JOIN sys.partitions AS p
			ON seg.hobt_id = p.hobt_id
		INNER JOIN sys.indexes AS i
			ON p.object_id = i.object_id
	WHERE i.type in (5, 6)
	GROUP BY i.name, p.object_id, p.index_id, i.type_desc;
![]()
Oha ! So actually, underneath it all we have a situation that even though our 100 segments should be hosting massive amounts of data compared to just 13 segments, in the reality they occupy a little bit less space (1.3 MB) as you can see on the picture above.
So let’s try to understand what is happening with our dictionaries:
-- Detailed information about Dictionaries
select
	OBJECT_NAME(t.object_id) as 'Table Name',
	sum(dict.on_disk_size)/1024./1024 as DictionarySizeMB
	from sys.column_store_dictionaries dict
	inner join sys.partitions as p
		ON dict.partition_id = p.partition_id
	inner join sys.tables t
		ON t.object_id = p.object_id
	inner join sys.indexes i
		ON i.object_id = t.object_id
	where i.type in (5,6) -- Clustered & Nonclustered Columnstore
	group by t.object_id
And here is what we have got:
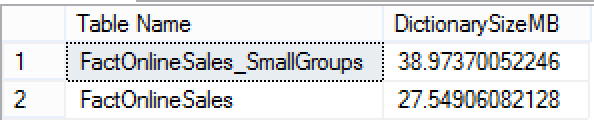 This is where we can see the difference between 2 tables, the dictionaries sizes for the FactOnlineSales_SmallGroups which has 100 Segments is definitely much bigger than the dictionaries sizes for the FactOnlineSales containing just 13 Segments.
The missing part should belong to such internal structures as Deleted Bitmaps, and as far as I know there is no way to consult its size or content directly. Unless of course someone will find a cool way with some internal function, such as DBCC CSIndex.
But what if we check out the sizes of our Dictionaries, corresponding to the columns that we have used in our query:
-- Dictionaries count & type per each of the column
select t.name as 'Table Name'
	,dict.column_id
	,col.name
	,tp.name
	,case dict.dictionary_id
		when 0 then 'Global Dictionary'
		else 'Local Dictionary'
	end as 'Dictionary Type'
	,count(dict.type) as 'Count'
	,sum(dict.on_disk_size) as 'Size in Bytes'
	,cast(sum(dict.on_disk_size) / 1024.0 / 1024 as Decimal(16,3)) as 'Size in MBytes'
	from sys.column_store_dictionaries dict
	inner join sys.partitions as p
		ON dict.partition_id = p.partition_id
	inner join sys.tables t
		ON t.object_id = p.object_id
	inner join sys.all_columns col
		on col.column_id = dict.column_id and col.object_id = t.object_id
	inner join sys.types tp
		ON col.system_type_id = tp.system_type_id AND col.user_type_id = tp.user_type_id
	where t.[is_ms_shipped] = 0
		and col.name in ('SalesAmount','ProductKey','CurrencyKey','PromotionKey')
	group by t.name,
			 case dict.dictionary_id
				when 0 then 'Global Dictionary'
				else 'Local Dictionary'
			 end,
			 col.name,
			 tp.name,
			 dict.column_id
	order by dict.column_id, t.name;
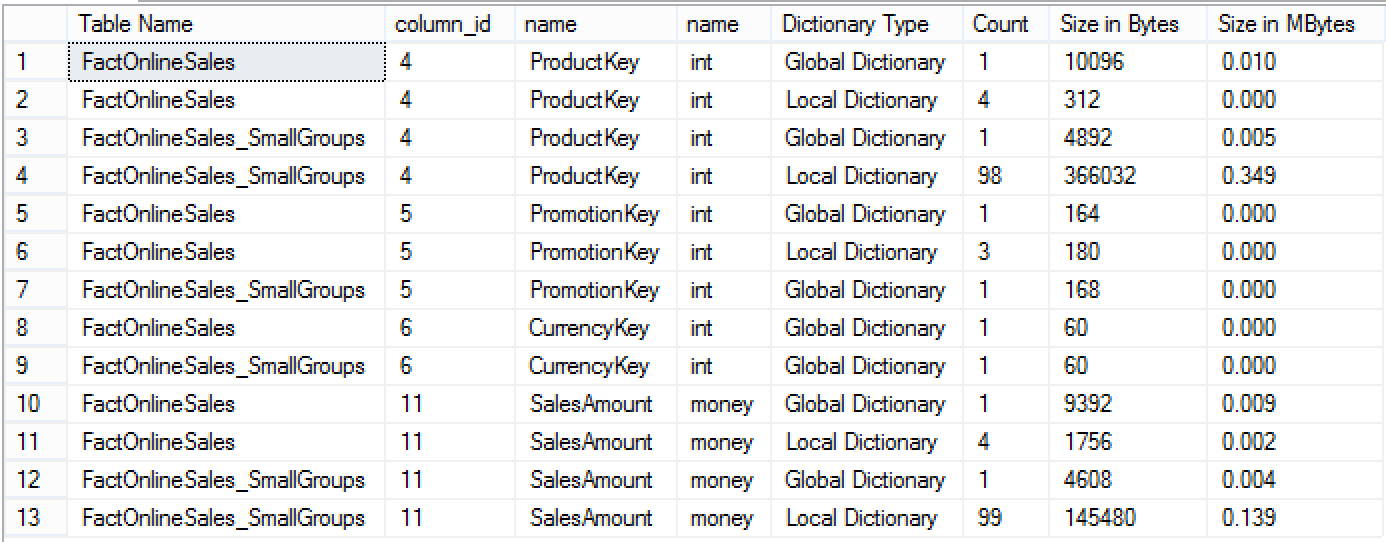
The dictionaries for the columns used in our test query are extremely small and they do not represent the actual weight of the dictionaries. We can look at them and notice that on some columns there are quite a number of local dictionaries, corresponding almost to each of the existing Segments.
If we re-run the previous query, this time without indications of the specific columns we can easily find the real weight behind the dictionaries sizes:
-- Dictionaries count & type per each of the column
select t.name as 'Table Name'
	,dict.column_id
	,col.name
	,tp.name
	,case dict.dictionary_id
		when 0 then 'Global Dictionary'
		else 'Local Dictionary'
	end as 'Dictionary Type'
	,count(dict.type) as 'Count'
	,sum(dict.on_disk_size) as 'Size in Bytes'
	,cast(sum(dict.on_disk_size) / 1024.0 / 1024 as Decimal(16,3)) as 'Size in MBytes'
	from sys.column_store_dictionaries dict
	inner join sys.partitions as p
		ON dict.partition_id = p.partition_id
	inner join sys.tables t
		ON t.object_id = p.object_id
	inner join sys.all_columns col
		on col.column_id = dict.column_id and col.object_id = t.object_id
	inner join sys.types tp
		ON col.system_type_id = tp.system_type_id AND col.user_type_id = tp.user_type_id
	where t.[is_ms_shipped] = 0
	group by t.name,
			 case dict.dictionary_id
				when 0 then 'Global Dictionary'
				else 'Local Dictionary'
			 end,
			 col.name,
			 tp.name,
			 dict.column_id
	order by dict.column_id, t.name;
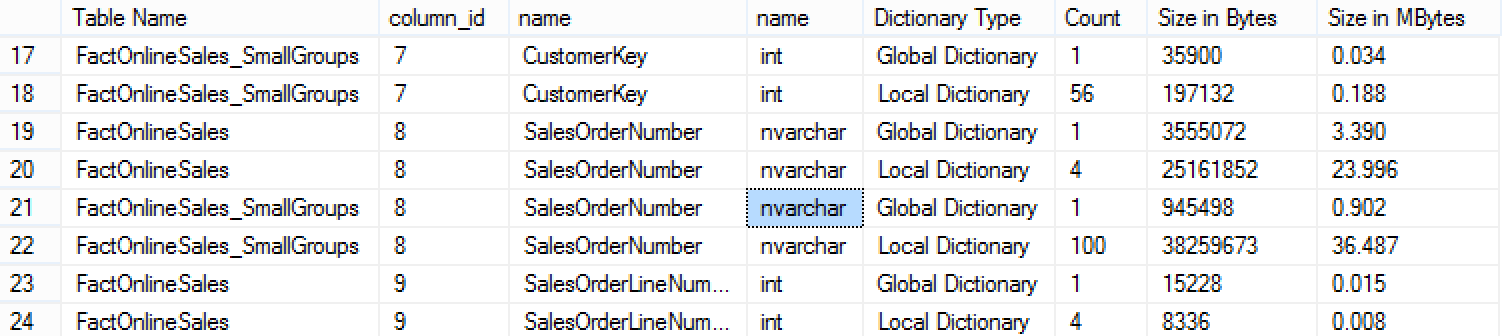
SalesOrderNumber is the column that uses the most space for the dictionaries and had we used it in our query, it would definitely increase the amount of memory required as well as the amounts of memory required to process the query.
As you can see, even if we would scan the whole table without any predicates, so many things would depend on the actual columns used.
So it all depends, isn’t it ? :)
Having smaller Row Groups can have its own advantages, you will need to test it in order to get a better understanding.
Disclaimer: I believe that Microsoft has very carefully selected the maximum size of the Row Groups, doing a lot of research before selecting it, but as an IT person, I wish could have an opportunity to control it in order to achieve better performance.
to be continued with Clustered Columnstore Indexes – part 33 (“Tuple Mover that closes open Delta-Stores”)
Let’s assume, I have 3,2 mio rows to load into a table with a columnstore index.
Usually (particularly when I load this in batches) this would result in 3 rowgroups with 1,048,576 rows each and one open rowgroup with 54,272 rows.
To prevent the open rowgroup, I could either
a) create 4 rowgroups with 800k each
b) or 2 rowgroups with 1,048,576 and two with 551,424 rows
c) or 2 rowgroups with 1,048,576; one with 102,400 rows and one with the remaining 1,000,448 rows
What would be the best / recommended option in this case?
Hi Thomas,
first of all you options will depend on the currently used version of SQL Server, because of the different approaches and optimisations – how SQL Server will allow you to load the data,
but in the end, I always prefer the Row Groups to be as big as possible and be similar in size. When they are equal, the query optimiser will be able to distribute work between cores in an easier way and guarantee that all of them shall finish at almost the same time.
Best regards,
Niko
Hi Niko,
thanks for the quick answer, when I interpret it correct, you tend to option a) because of equal data distribution (which makes absolute sense to me, particularly because I did not think about it before).
best regards,
Thomas
Hi Thomas,
yeap – you put it perfectly!
This is what the ultimate goal of the engine when building the Row Groups.
Best regards,
Niko